ROAS vs ROI for LinkedIn B2B Campaign Evaluation
Measuring LinkedIn B2B campaigns on 30 days hides their true profitability.

A LinkedIn B2B campaign can look like a money pit and a growth engine at the same time. It depends entirely on when you check. That's not a riddle. It's a measurement problem, and it's costing marketing teams their budgets and their credibility with the people who sign off on them.
What a 30-day ROAS shows for a LinkedIn B2B campaign
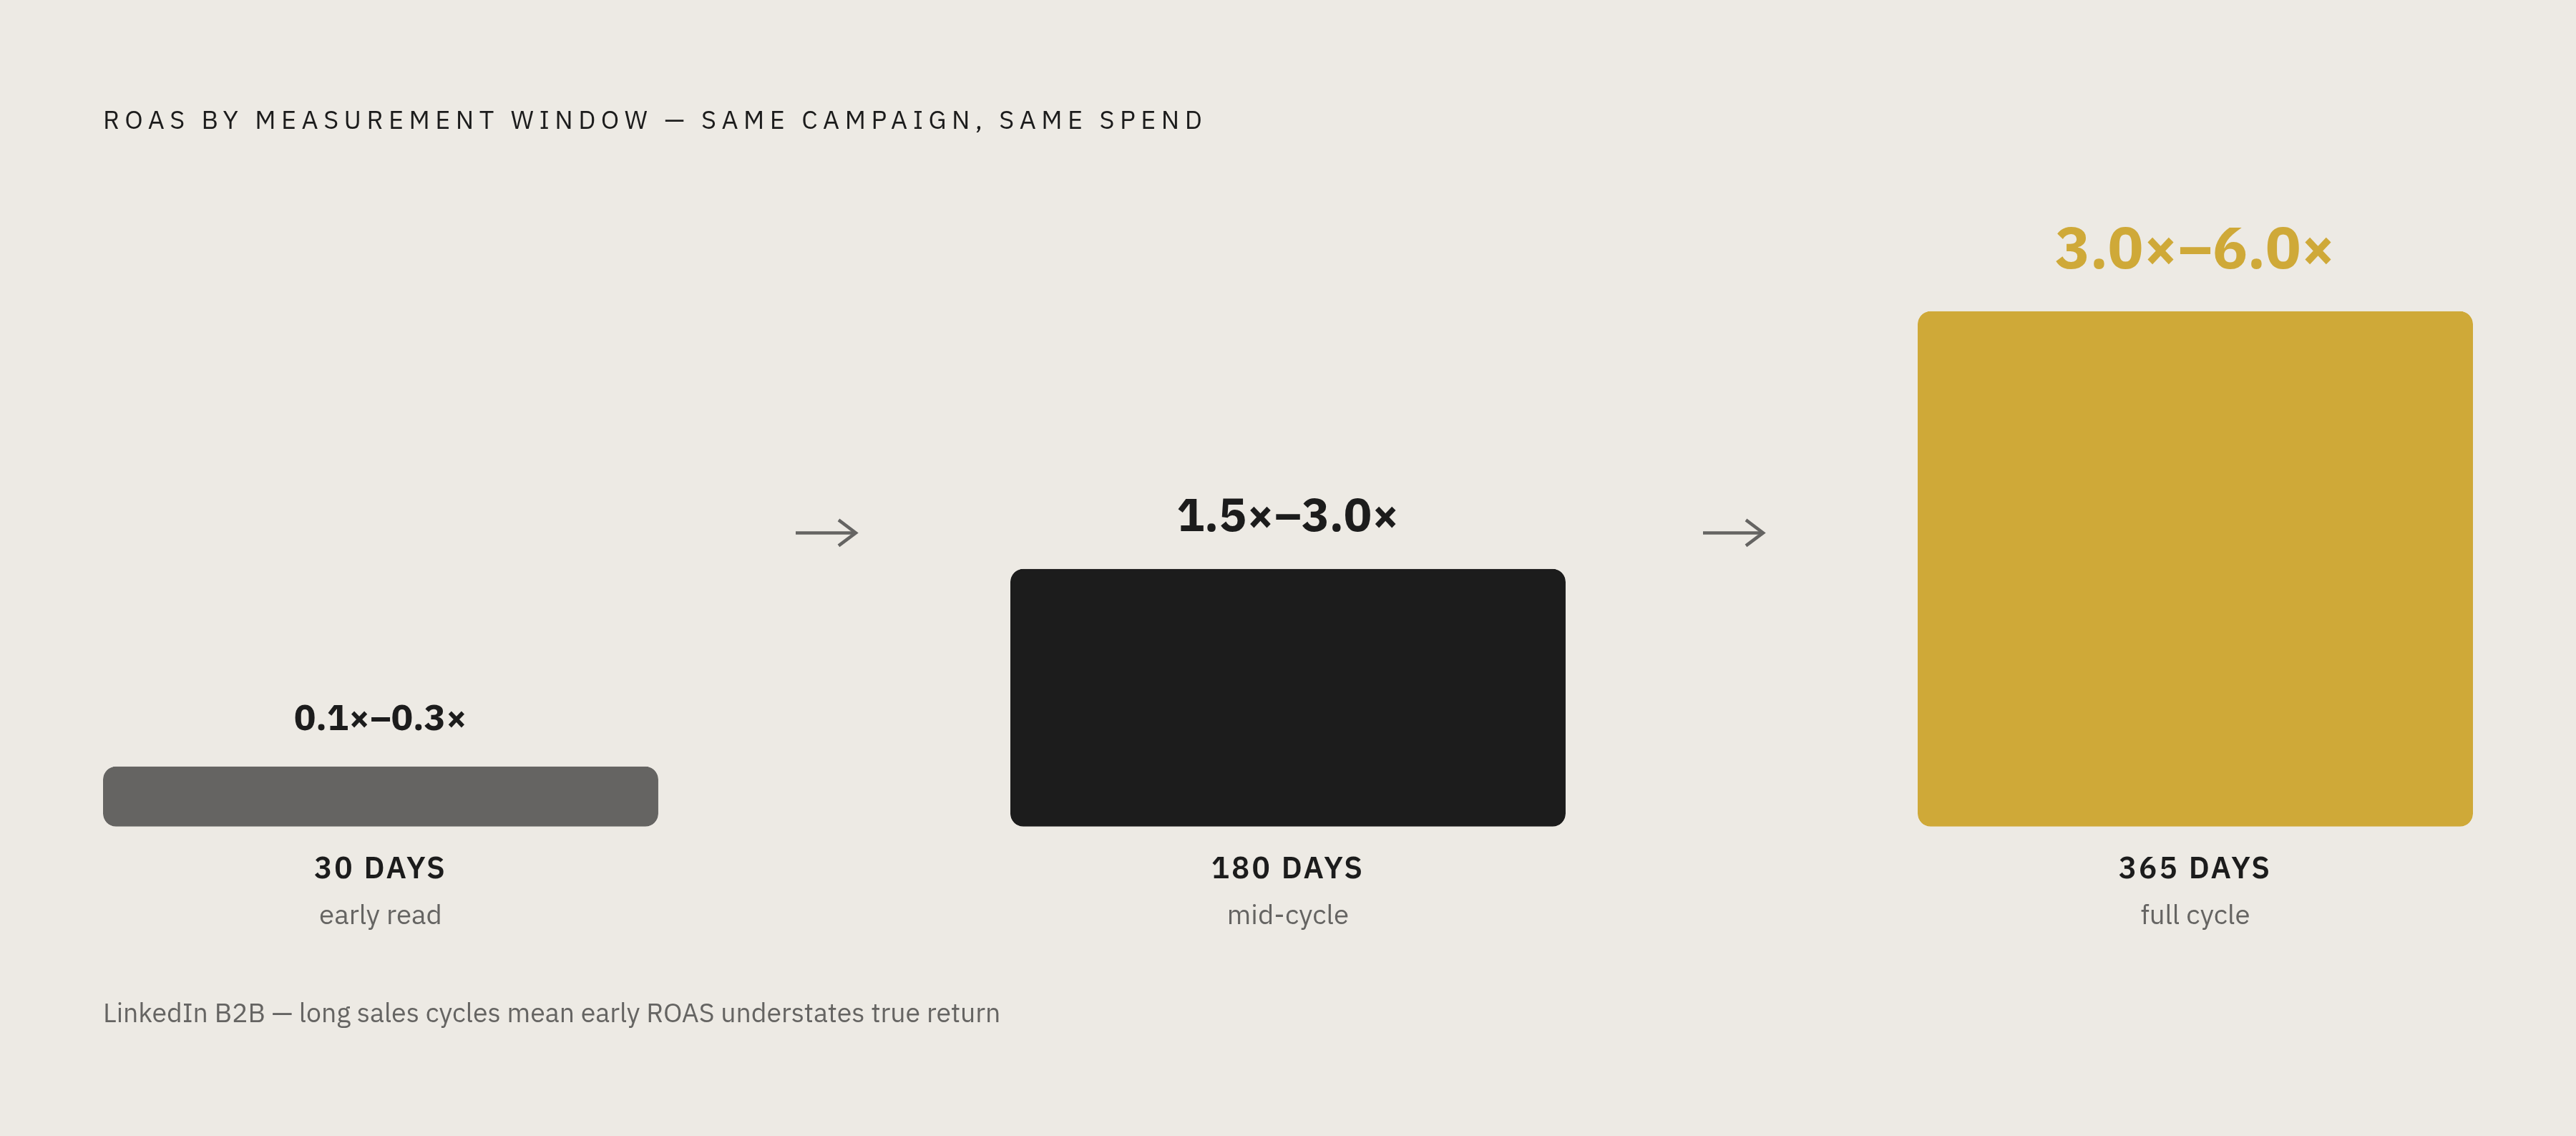
Run a LinkedIn B2B campaign, wait 30 days, and pull the numbers. According to tracking data cited by GrowthSpree, most campaigns return between 0.1x and 0.3x on ad spend in that window. Spend a dollar, get back ten to thirty cents in attributed revenue. Spend a dollar, get back ten to thirty cents in attributed revenue, and that is the number.
Put that in front of a CFO and there's only one conclusion to draw: this channel is losing money. Sometimes losing it badly. The natural next move is to cut the spend, shift the budget to Google Search or Meta, or call the marketing team in to explain themselves.
Here's the catch. The same GrowthSpree data show that tracking that same spend out to 180 days brings the return up to 1.5x to 3.0x. Wait a full year and it's 3.0x to 6.0x. Same dollars. Same campaign. Wildly different verdict, depending only on when you stopped the clock.
So why does this keep happening? Part of it is confidence that isn't backed by practice. Nielsen's 2025 Marketing ROI Blueprint found that 85% of marketers say they can measure ROI across the full picture. Only 32% actually do it. That's a big gap between what teams believe about their own reporting and what their reporting actually shows them. And it's not a small stakes problem either: Deloitte found that 64% of CMOs name proving marketing's value to the business as their single biggest challenge. Get the measurement wrong here and it's not just an analytics error. It's a career risk.
The 30-day number is more than low. It's actively pointing decision-makers in the wrong direction.
LinkedIn's actual B2B performance compared to Google and Meta when measured correctly
Fix the measurement window and the story flips. Dreamdata's 2026 LinkedIn Ads Benchmarks Report, built from a very large set of sessions and customer journeys, puts LinkedIn's B2B ROAS at 121%. That makes it the only major paid channel that clears breakeven. Google Search is 67%. Meta at 51%.
And the direction of travel matters as much as the snapshot. LinkedIn moved up from 113% in 2025 to 121% in 2026. Google Search moved the other way, dropping from 78% to 67% over the same stretch. The gap is widening. It's opening wider.
Among Dreamdata's top-quartile customers, LinkedIn ROAS reaches 279%. That range, from breakeven-plus to nearly triple, says something important: this isn't a channel where everyone gets the same outcome by default. Execution matters enormously.
There's also a deal-size story that Dreamdata data reveals: LinkedIn-sourced deals carry average contract values 28.6% larger than deals sourced elsewhere. Dreamdata data shows LinkedIn-sourced deals carry average contract values 28.6% larger than deals sourced elsewhere. A lead that costs more to generate can still be the cheaper path to revenue, once you weigh in what that lead is actually worth when it closes.
The market appears to have noticed. Dreamdata's figures show budgets shifting toward LinkedIn. Meanwhile non-branded search budgets have shrunk from 37% of spend in 2024 to 33% in 2025, even as the cost per click on those terms has jumped 29%. Dollars are moving toward the channel that reaches buyers earlier, and away from the one that's getting more expensive to reach them late.
None of these numbers make sense on a 30-day window. They only resolve once you measure on a timeline that matches how the deal actually happened.
Why the B2B buying committee structure makes any single-touch or short-window metric unreliable
B2B purchases aren't made by one person clicking one ad. Forrester and 6sense put the median buying group at 11.2 people for deals over $50,000, up from 9.7 the year before. Gartner's estimate is six to ten people, sometimes as many as eleven, spread across four different functions in complex purchases.
Sales cycles stretch to match. Mid-market deals run 121 days on average. Forrester and 6sense report that enterprise deals run 218 days. Neither one fits inside a 30-day attribution window. Not close.
This creates what amounts to an identity problem for attribution. B2B tracking tools follow accounts, not individuals, because six to ten different people are engaging with a brand through different channels over months. The person who clicked the LinkedIn ad might not be the person who signs the contract. Often isn't.
And most of the real decision-making happens somewhere no ad platform can see. Recent data show buyers complete roughly 60% of their research on their own before a vendor even knows they exist. By the time sales gets a call, the buyer has already formed most of their opinion.
That opinion tends to be sticky. 6sense's 2025 Buyer Experience Report found the winning vendor was already on the buyer's Day-One shortlist 95% of the time, and 80% of sellers report being contacted first by the vendor the buyer intended to purchase from. Whatever built that shortlist happened long before anyone tracked a click.
LinkedIn's influence doesn't fade as deals mature, it grows. Dreamdata's 2026 data shows LinkedIn ad influence accounting for 24.2% of sessions at the MQL stage, rising to 30.2% at SQL, and holding at 28.3% by the time a deal becomes new business. That's not a top-of-funnel-only channel. It's present the whole way through.
Put it together and the conclusion is hard to avoid: no single click, on any single day, can represent a decision made by ten-plus people over nine months across multiple channels. Asking a 30-day ROAS number to do that job is asking it to do something it was never built to do.
The measurement framework that reflects how B2B pipeline forms
If 30-day ROAS is the wrong yardstick, what replaces it? Pipeline ROI and revenue ROI, tied directly to CRM closed-won data, measured over windows that actually match the sales cycle. Not platform-reported numbers on a 30-day clock.
Concretely, that means tracking ROAS at 180-day and 365-day cohorts connected to the CRM, the windows that produce the 1.5x to 6.0x figures above. Group leads by the month they were generated, then check pipeline and revenue at those two later points. That keeps the connection between when a lead came in and what it eventually became, without forcing revenue to show up before it's ready to.
Pipeline ROI works as an earlier signal while revenue is still catching up. A report from HockeyStack, covering more than 70 B2B SaaS companies spanning a wide range of annual recurring revenue and a substantial combined ad spend across three years, found Q3 delivering 6.01x pipeline ROI. That's spend-to-pipeline, not spend-to-revenue. It won't tell you the final number, but it tells you faster whether the campaign is working.
Cost per lead needs the same rethink. A cheap lead that never converts is worthless. A more expensive lead that converts to pipeline at a higher rate is the better deal. Track cost per SQL and cost per opportunity instead. That's where the real signal lives.
None of this works without the plumbing that produces it: CRM integration so ad platforms get credited against real opportunities instead of form fills, and UTM conventions plus identity resolution so a multi-touch, multi-stakeholder journey rolls up to one account record instead of scattering across ten different profiles.
Attribution model choice matters here too. Last-touch attribution systematically shorts LinkedIn, which does most of its work early and in the middle of the funnel, and inflates Google Search, which tends to capture the final click. Position-based or full-path models spread credit more fairly across the whole journey.
And this isn't a set-it-and-forget-it system. Teams that get this right treat it as an ongoing discipline: reviewing attribution reports regularly, updating the model as cycles evolve, and holding themselves to attributed ROI targets when planning next quarter's budget. It's a discipline, not a one-time setup.
How Google and LinkedIn divide the funnel, and why measuring them separately distorts both
LinkedIn and Google Search aren't competing for the same job. They're doing two different jobs in sequence. LinkedIn builds demand during the long, quiet research phase, before a buyer has even decided what solution they want. Google Search shows up later, catching that buyer the moment they type in a query with an opinion already formed.
Measure each platform on its own, using last-touch or a short attribution window, and the picture gets distorted for both. LinkedIn looks expensive and weak. Google looks lean and efficient. But Google is getting credit for a conversion that months of LinkedIn exposure made possible.
The numbers back this up: Google Search's 67% ROAS against LinkedIn's 121%, on Dreamdata's 2026 corrected basis, doesn't mean Google is worse at persuading buyers. It means Google is catching buyers who are already decided. That's a different skill than creating the decision.
Cut LinkedIn to make Google's efficiency numbers look better, and here's what tends to happen: Google keeps capturing demand that already exists, but it's living off a supply of already-convinced buyers that LinkedIn was replenishing. Turn off the replenishment and the well runs dry.
The better cross-channel question is not which platform won more last-click conversions this month. It's how much pipeline this quarter's LinkedIn spend is building for Google to close two or three quarters from now.
Swydo's 2026 guidance offers a workable rule of thumb: lean on LinkedIn as the primary channel for deal values over $10,000, sales cycles of six months or longer, or when you need to reach specific job titles. Lean on Google Search when the sales cycle runs under three months and there's active search volume already. Use both when the cycle runs in the three-to-six month range. The decision follows the economics of the sale, not which platform has the cheaper click.
What good pipeline-oriented campaign execution looks like in practice
Getting the measurement framework right is only half the job. The campaigns feeding that framework need to be built the right way too.
Start with targeting. Accounts outside the ideal customer profile, wrong industry, wrong company size, wrong seniority level, burn through budget and produce nothing. Firmographic exclusion lists need building, and they need refreshing every quarter, not once and forgotten.
Tighter targeting routinely produces this pattern: lead volume falls once the audience is narrowed, but lead-to-opportunity conversion rates rise and qualified opportunities increase. Fewer leads. Far more pipeline. That's the trade almost every B2B team should be willing to make.
Creative wears out fast. Fatigue sets in within weeks, which means a monthly refresh with new angles and formats isn't optional polish, it's baseline maintenance.
Sales input is not a courtesy, it's a data source. Without weekly feedback from sales on lead quality by campaign, the whole system starts optimizing for platform metrics instead of pipeline, because platform metrics are the only signal left.
On format, LinkedIn Lead Gen Forms convert at 13% on average, compared with 4.02% for standard landing pages, based on sourced benchmarks. That friction reduction is real and worth using. But a form fill isn't the finish line. Track it against what happens next in the pipeline, not as the outcome itself.
Keep demand creation and demand capture separate in your head, because they need separate everything. A campaign built to reach buyers during that long silent research phase, built around awareness and education and thought leadership, needs different creative, different conversion goals, and different success metrics than a bottom-funnel retargeting campaign aimed at someone already close to buying. Folding both into one ROAS number is comparing two different jobs as if they were one.
And every campaign cycle should leave something behind: audience insights, creative performance data, funnel conversion rates. Teams that start each new campaign from scratch are throwing away the most useful thing the last one produced.
Who owns the measurement problem, and what it costs when no one does
All of this, the cohort tracking, the CRM integration, the attribution model, the sales feedback loop, needs someone responsible for holding it together. In most B2B companies, that job falls into the gap between marketing ops, demand gen, and sales. Everyone touches a piece of it. No one owns the whole thing.
Nielsen's 2025 number shows that gap: 85% of marketers believe they can measure ROI across the full picture, but only 32% actually do. That's not a tooling problem. The tools to close that gap already exist. It's an accountability problem. Nobody's job depends on closing it.
The cost of that gap is real: budget misallocation from poor attribution redirects spend away from the channels actually driving pipeline, every year. That misdirected budget compounds quietly, campaign after campaign.
Agencies paid on media spend have their own blind spot here. When the incentive is tied to how much budget moves through a platform, there's pressure to show activity and platform-reported wins, not to build a pipeline ROI framework that might turn around and recommend spending less.
What closes the gap is a named owner across the whole stack: campaign strategy, attribution setup, CRM integration, creative refresh cadence, sales feedback. That owner needs to be judged on pipeline and revenue, not on clicks or platform dashboards. Whether that sits in-house, with an agency, or through some other delegated structure, the accountability has to match the measurement framework. Someone has to be looking at the 365-day view, not just refreshing the monthly report.
The number sitting in the dashboard was never the real problem. The problem is building a budget case on a metric that was never designed to capture a nine-month, ten-person buying journey. Fix the window, name an owner, and the number the dashboard shows starts telling the truth.
Sources
- Marketing ROI Statistics 2026
- LinkedIn Ads vs Google Ads for B2B — How to Pick the Right Platform - Swydo
- Announcing The LinkedIn Ads 2026 Benchmarks Report — Dreamdata
- LinkedIn Ads Benchmark Report for 2025 | HockeyStack Labs
- LinkedIn B2B Marketing Statistics and Trends for 2026
- omnibound.ai
- LinkedIn Ads B2B: 2026 Costs & ROI
- omnibound.ai