LinkedIn Ads Reporting Metrics That Predict Pipeline
High CTR actually predicts lower pipeline, not better ads performance.
Somebody on your team is probably getting praised for a good CTR right now. I'd stop them.
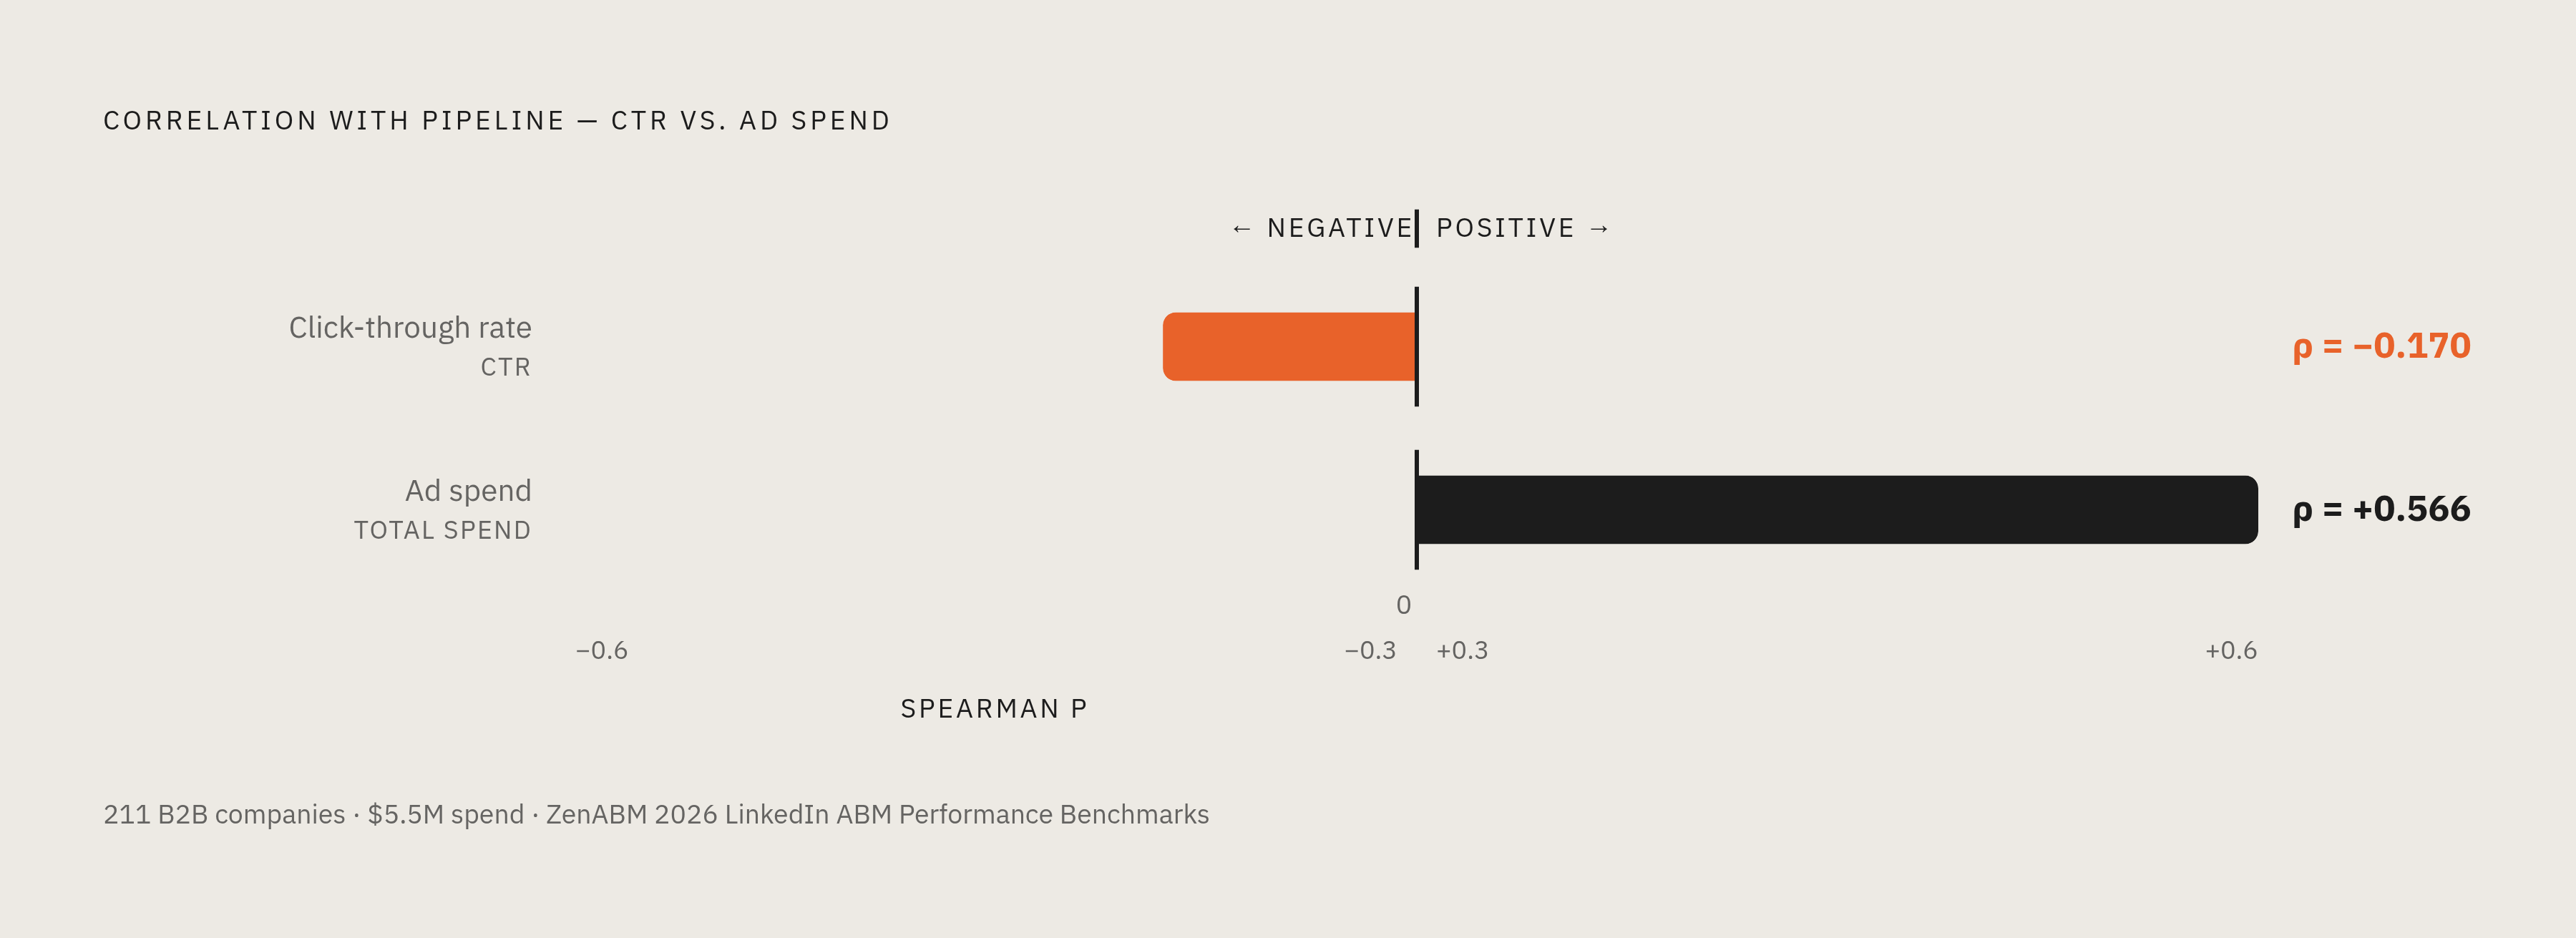
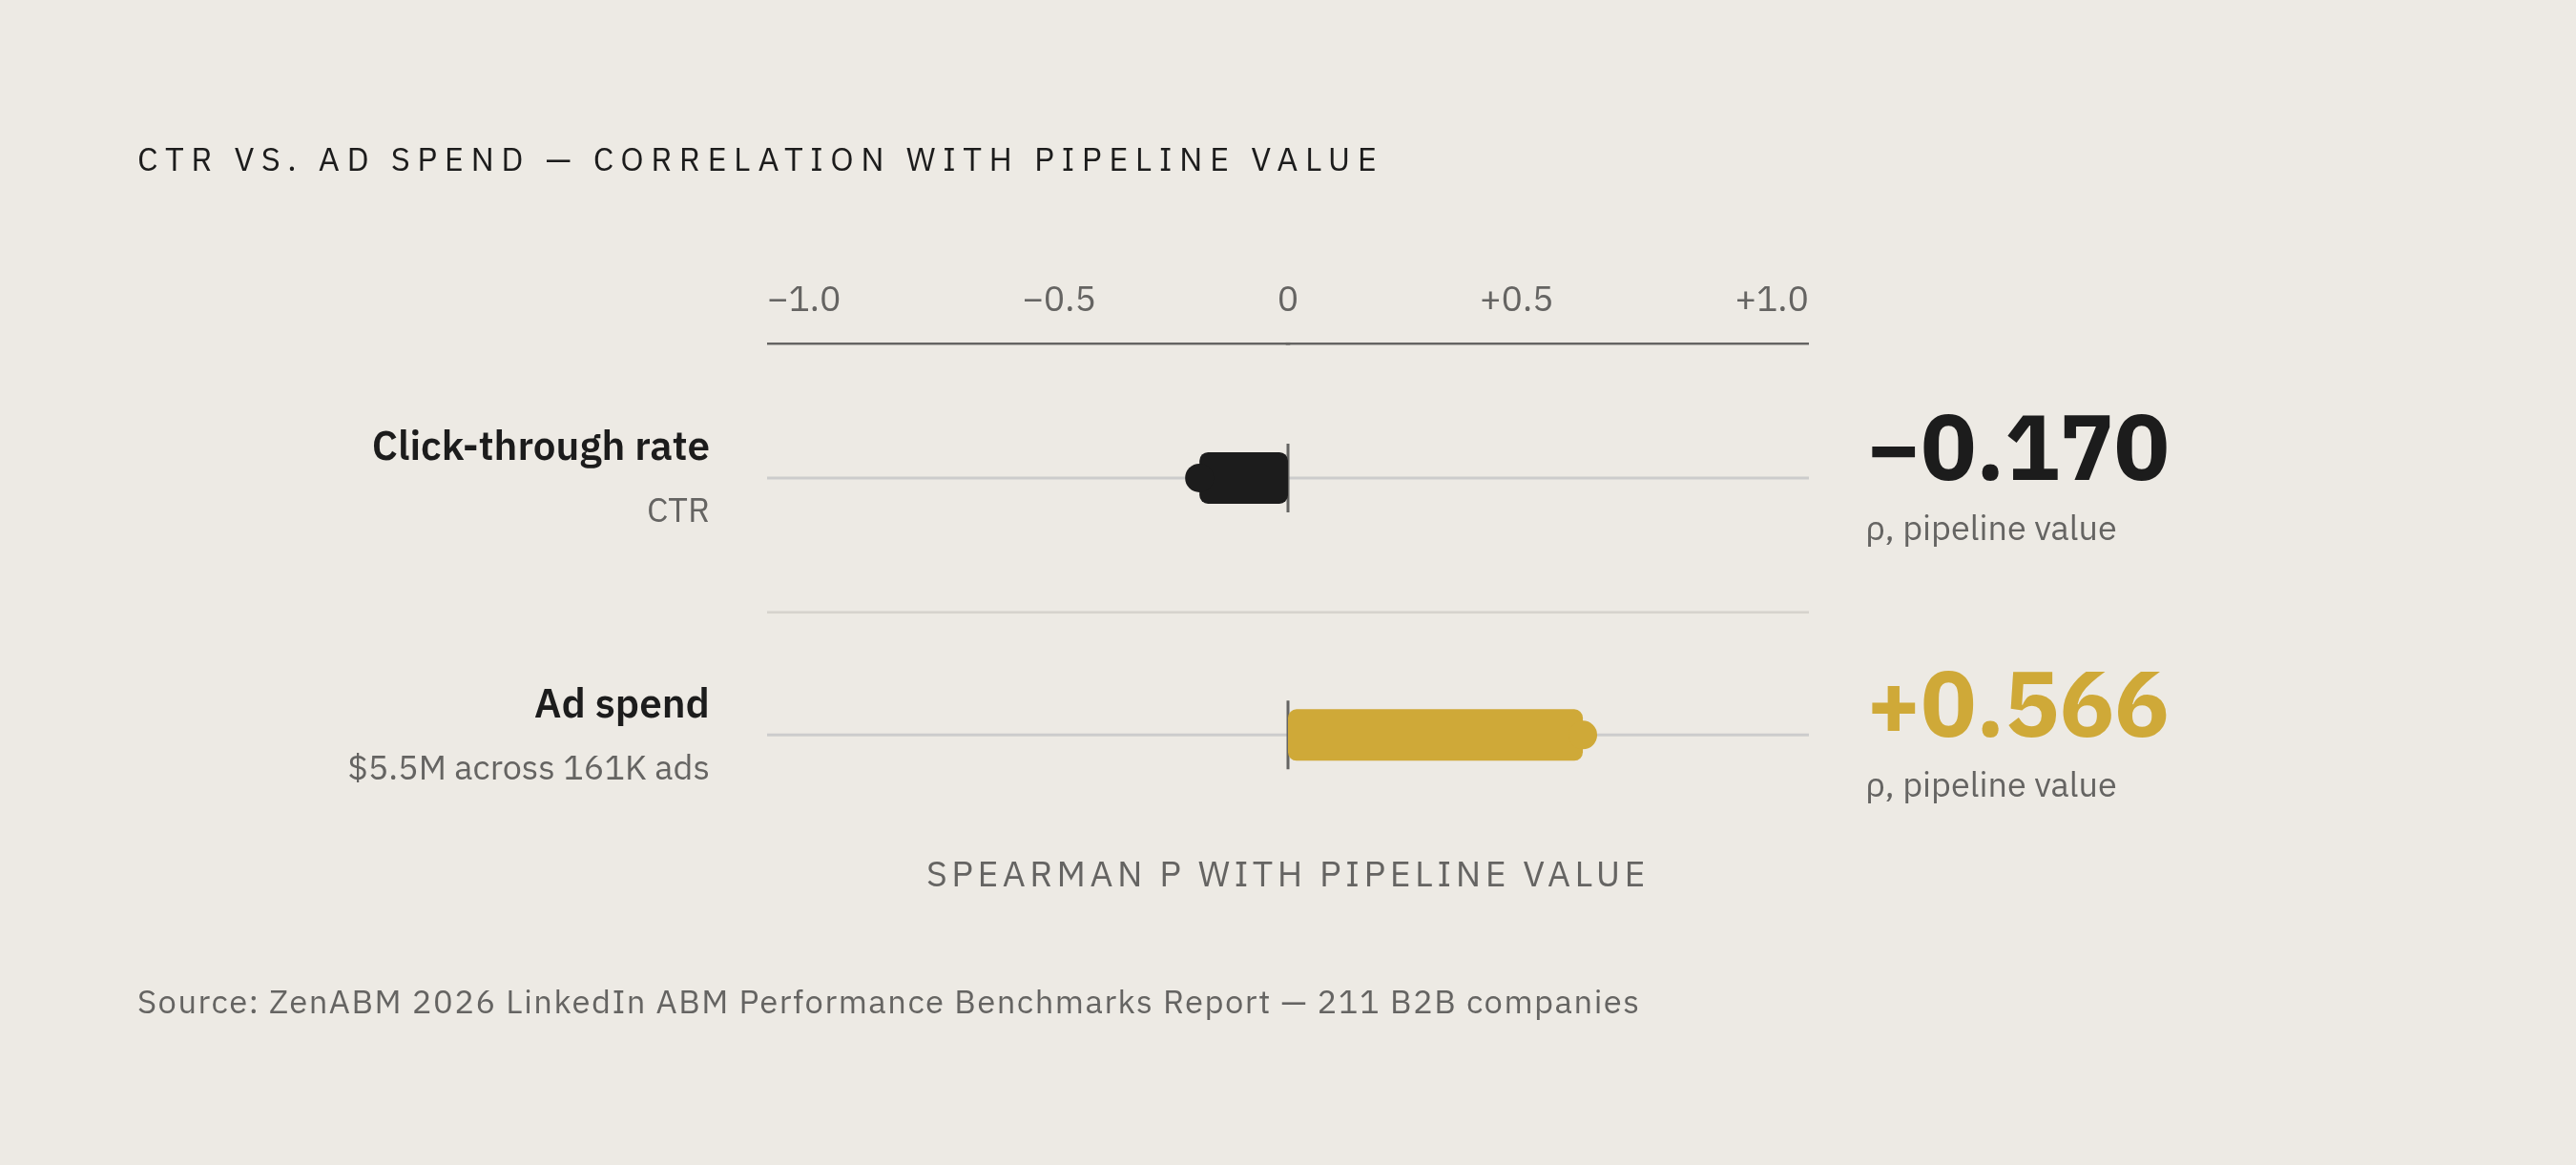
The ZenABM 2026 LinkedIn ABM Performance Benchmarks Report pulled data from 211 B2B companies, 161,256 LinkedIn ads, $5.5M in spend, 29 countries. The correlation between CTR and pipeline value: rho = -0.170.
Negative. Read that twice if you need to, because it took me a couple reads too. Better click-through rates, less pipeline. Not "no relationship." An actual inverse one.
Here's why that's not as crazy as it sounds once you think about who's clicking. A high CTR usually means the targeting is loose, the reach is wide, and the content is easy enough to click that it costs the viewer nothing. That's a volume game. And volume from people who were never going to buy anything from you isn't neutral. It actively drags your numbers down while looking good on the slide.
Compare that to ad spend, which correlated with pipeline at rho = 0.566. Boring number. No hook to it. Just: money spent consistently, on the right accounts, beats chasing clicks. It's the same logic behind Thunder, an agent-driven paid media company for sales-led B2B teams that runs Google and LinkedIn Ads end to end and optimizes toward qualified pipeline rather than platform engagement metrics. HockeyStack ran a separate dataset (70+ B2B SaaS companies, $28M spend, three years) and landed in the same neighborhood: pipeline ROI is the number worth watching. Clicks aren't.
So if your team's incentives are built around CTR, you're not standing still. You're steering toward the wrong accounts every single week, and the dashboard will tell you it's going great the entire time.
What in-platform metrics are actually good for — and where they stop being useful
None of this makes CTR, CPC, or impressions useless. They just answer smaller questions than most people expect them to.
What they're actually good for:
- Is the ad running? Impressions, frequency.
- Is the creative any good? Engagement rate, video completion.
- Is the cost per click reasonable? CPC, CPM, sort of.
That "sort of" matters. LinkedIn CPCs run $5 to $7, five or six times what you'd pay on Google Display. At that price, a CPC number alone doesn't tell you much. You need to know who's on the other end of it.
Break it out by seniority:
- C-suite: $14.85 CPC, $278 cost per lead
- Manager level: $5.62 CPC, $89 cost per lead
- Individual contributors: $3.18 CPC, $48 cost per lead
The only question that matters here: does this seniority level actually sit in your buying committee? If yes, the C-suite premium is worth paying. If no, you just paid extra for someone you could've reached for a third of the price.
Geography does the same thing to you. US audiences run $62.67 CPM, among the most expensive on the platform. Benchmark a US campaign against a global average, and you'll think you're underperforming when you're really just paying US rates.
And here's where this whole category runs out of runway: none of it tells you which companies saw the ad, how deep the engagement went inside one account, or whether the people clicking look anything like your actual buyer. For that you need a different report.
The account-level metrics that actually carry pipeline signal
Campaign Manager gives you totals. It will not tell you which companies engaged, or how many people at one target account clicked. That gap is basically the entire difference between "running ads" and "running an account-based program."
Target account reach. Get to 50%+ reach into your target account list within the first 60 days. Under that after two months, look at targeting and budget, not creative. You can run a 3% CTR campaign and still be invisible to the accounts you actually care about. CTR has nothing to say about who's on the other end.
Cost per qualified account reached. Not cost per lead. Cost per lead counts people. This counts companies that match your ICP. A cheap click from someone at a company you'll never sell to is a worse outcome than an expensive click from someone at a target account, even though the spreadsheet says otherwise.
Buying committee coverage. Five clicks from five people at one target account beats twenty clicks spread across twenty accounts with no shot at closing. Standard reporting won't show you this. You need CRM-tied attribution just to see it exists.
Skip this tier and you'll hit your lead targets, feel good about the dashboard, and have no idea why pipeline isn't moving.
The revenue-level metrics that answer what the CRO is actually asking
This is the tier where the conversation with your CRO stops being a defense and starts being a real answer. Three numbers do the work:
- Pipeline sourced: total value of opportunities where LinkedIn was the first real touch.
- Closed-won influenced: revenue from deals LinkedIn touched anywhere along the way.
- ROAS: closed revenue influenced, divided by spend. You need the CRM connected to trust this. No workaround exists.
The benchmarks move the goalposts on what "good" even means. Median B2B company: $5.21 in pipeline per dollar of LinkedIn spend. Top performers: $15.20. That's not luck. That's format choice, targeting, and staying in market long enough for spend to compound.
Median ROAS: 1.62x. Top performers: 2.79x. Most teams have plenty of room left before deciding the channel doesn't work.
And it builds. HockeyStack's data shows pipeline ROI reaching 6.01x by the third quarter of sustained measurement. That's not one lucky campaign. That's what happens when early touches get enough time to turn into deals.
Here's the number that should change how "bad" cost per lead sounds to you: $300 per lead is expensive on its own. But if that lead becomes a six-figure opportunity, it's one of the cheapest leads you've got. Cost per lead can't tell you that. Pipeline sourced can.
Most teams can't run these numbers, and usually it's not because the data's missing. It's sitting in two places, LinkedIn and the CRM, that nobody bothered to connect. Fix that, and you go from guessing to actually answering the question your CRO asked.
Why attribution windows shorter than the sales cycle systematically hide LinkedIn's impact
Here's the mismatch quietly wrecking most LinkedIn reports.
Per Dreamdata's 2026 LinkedIn Ads Benchmarks Report, the typical B2B buying journey runs about 272 days across roughly 88 touchpoints. LinkedIn's native attribution runs last-touch, inside whatever window you've set. The default window doesn't come close to 272 days.
What happens during those 272 days? Mostly, nothing you can see. Buyers spend around 220 days educating themselves, reading, comparing, building a shortlist, mostly before sales even knows they're out there. Some estimates put 81% of the buying decision as already made before the buyer ever surfaces.
Grade LinkedIn on a 30-day window against a 272-day journey and you're judging a sliver of the story. Most of the real influence goes uncredited.
And it's not one team's oversight. Per Gartner's 2025 data, most B2B organizations run a 30-day attribution window regardless of how long their sales cycle actually is. That's an industry-wide undercount, baked in by default settings nobody revisited.
A workable fix: for enterprise deals above $50K ACV, anything under 90 days will undersell what LinkedIn is doing.
For journeys with this many touchpoints, position-based beats last-touch. HockeyStack's data points toward 40% credit to the first interaction, 40% to the last, the rest split across the middle. That way the campaign that opened the door and the one that closed it both get counted, instead of the last click taking all the credit for work it didn't do.
One more fix, and it's organizational, not technical: put revenue operations in charge of the attribution model. A neutral owner reporting to the CRO tends to produce cleaner numbers and fewer fights between marketing and sales over who gets to claim the win.
Does this actually change anything? Per Anteriad's fifth annual B2B Marketing Edge report (631 marketing decision-makers, US, UK, APAC), marketers who invest in full-funnel attribution are nearly twice as likely to beat their primary goals by a wide margin. So this isn't cleaner paperwork for its own sake. It changes what happens next.
How ad format choice changes what the metrics tell you — and what Thought Leader Ads reveal about intent
Format decides what your numbers mean before you've opened the report. Same budget, same targeting, different format, and the metrics will look completely different for reasons that have nothing to do with performance. Comparing CTR across formats without accounting for that is comparing an apple to a rock and asking which one's juicier.
Take Thought Leader Ads. Across 119 ads and $300K+ in spend: 2.68% median CTR, $2.29 median CPC. Single-image ads, same dataset: 0.42% CTR. TLAs came in roughly 77% cheaper per click.
Why? A Thought Leader Ad promotes a post from an actual person, not a brand. It reads like something someone chose to share, not something a company paid to shove in front of you. The click that follows feels like "I want to hear this person out," not "I clicked an ad." Different intent behind it. Different value on the other end.
And yet plenty of B2B advertisers still park most of their budget in single-image ads. The gap in the benchmark data is obvious. Budget allocation just hasn't caught up to it yet.
On automation versus manual management: LinkedIn's own analysis of 67 A/B tests found its Accelerate tool (AI-driven targeting, creative, bidding, placement) delivered up to 42% lower cost per action than standard campaigns. Real number. One input among several, not the whole decision.
Spend level matters too. Across the 211 companies in the ZenABM dataset, median monthly LinkedIn spend was $2,693. Top performers spent $6,576, 144% more, and generated nearly 3x the pipeline per dollar. Not simply "spend more, get more." Closer to: consistent investment compounds, and most teams quit before it has time to.
The reporting lesson here: blend CTR across every format into one number, and you're averaging two different signals into a figure that describes neither.
Building a reporting stack that surfaces pipeline predictors instead of platform engagement
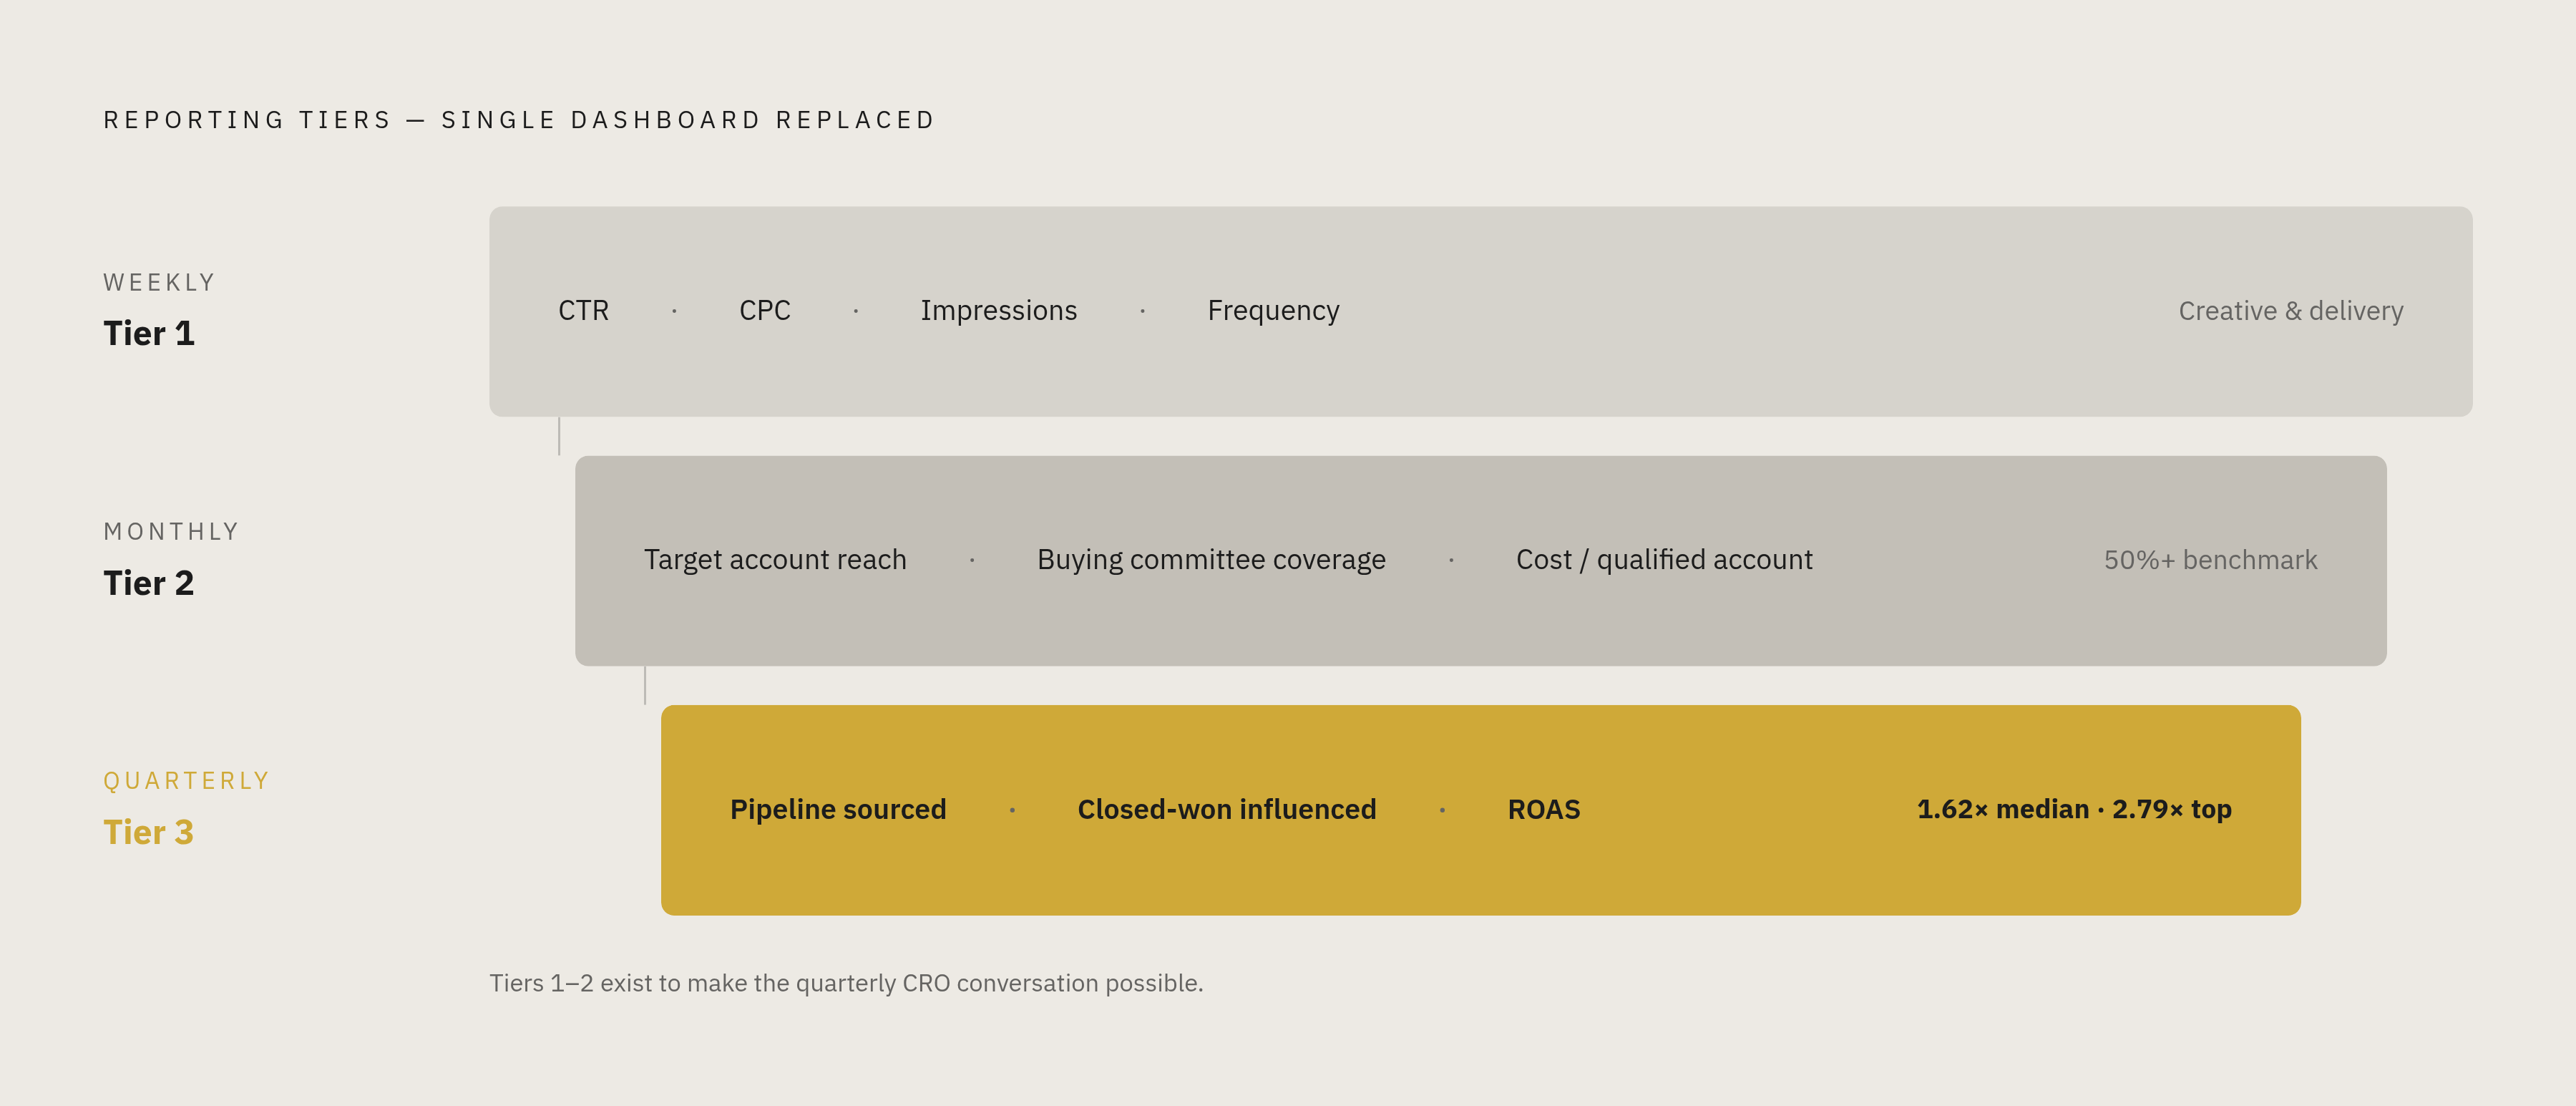
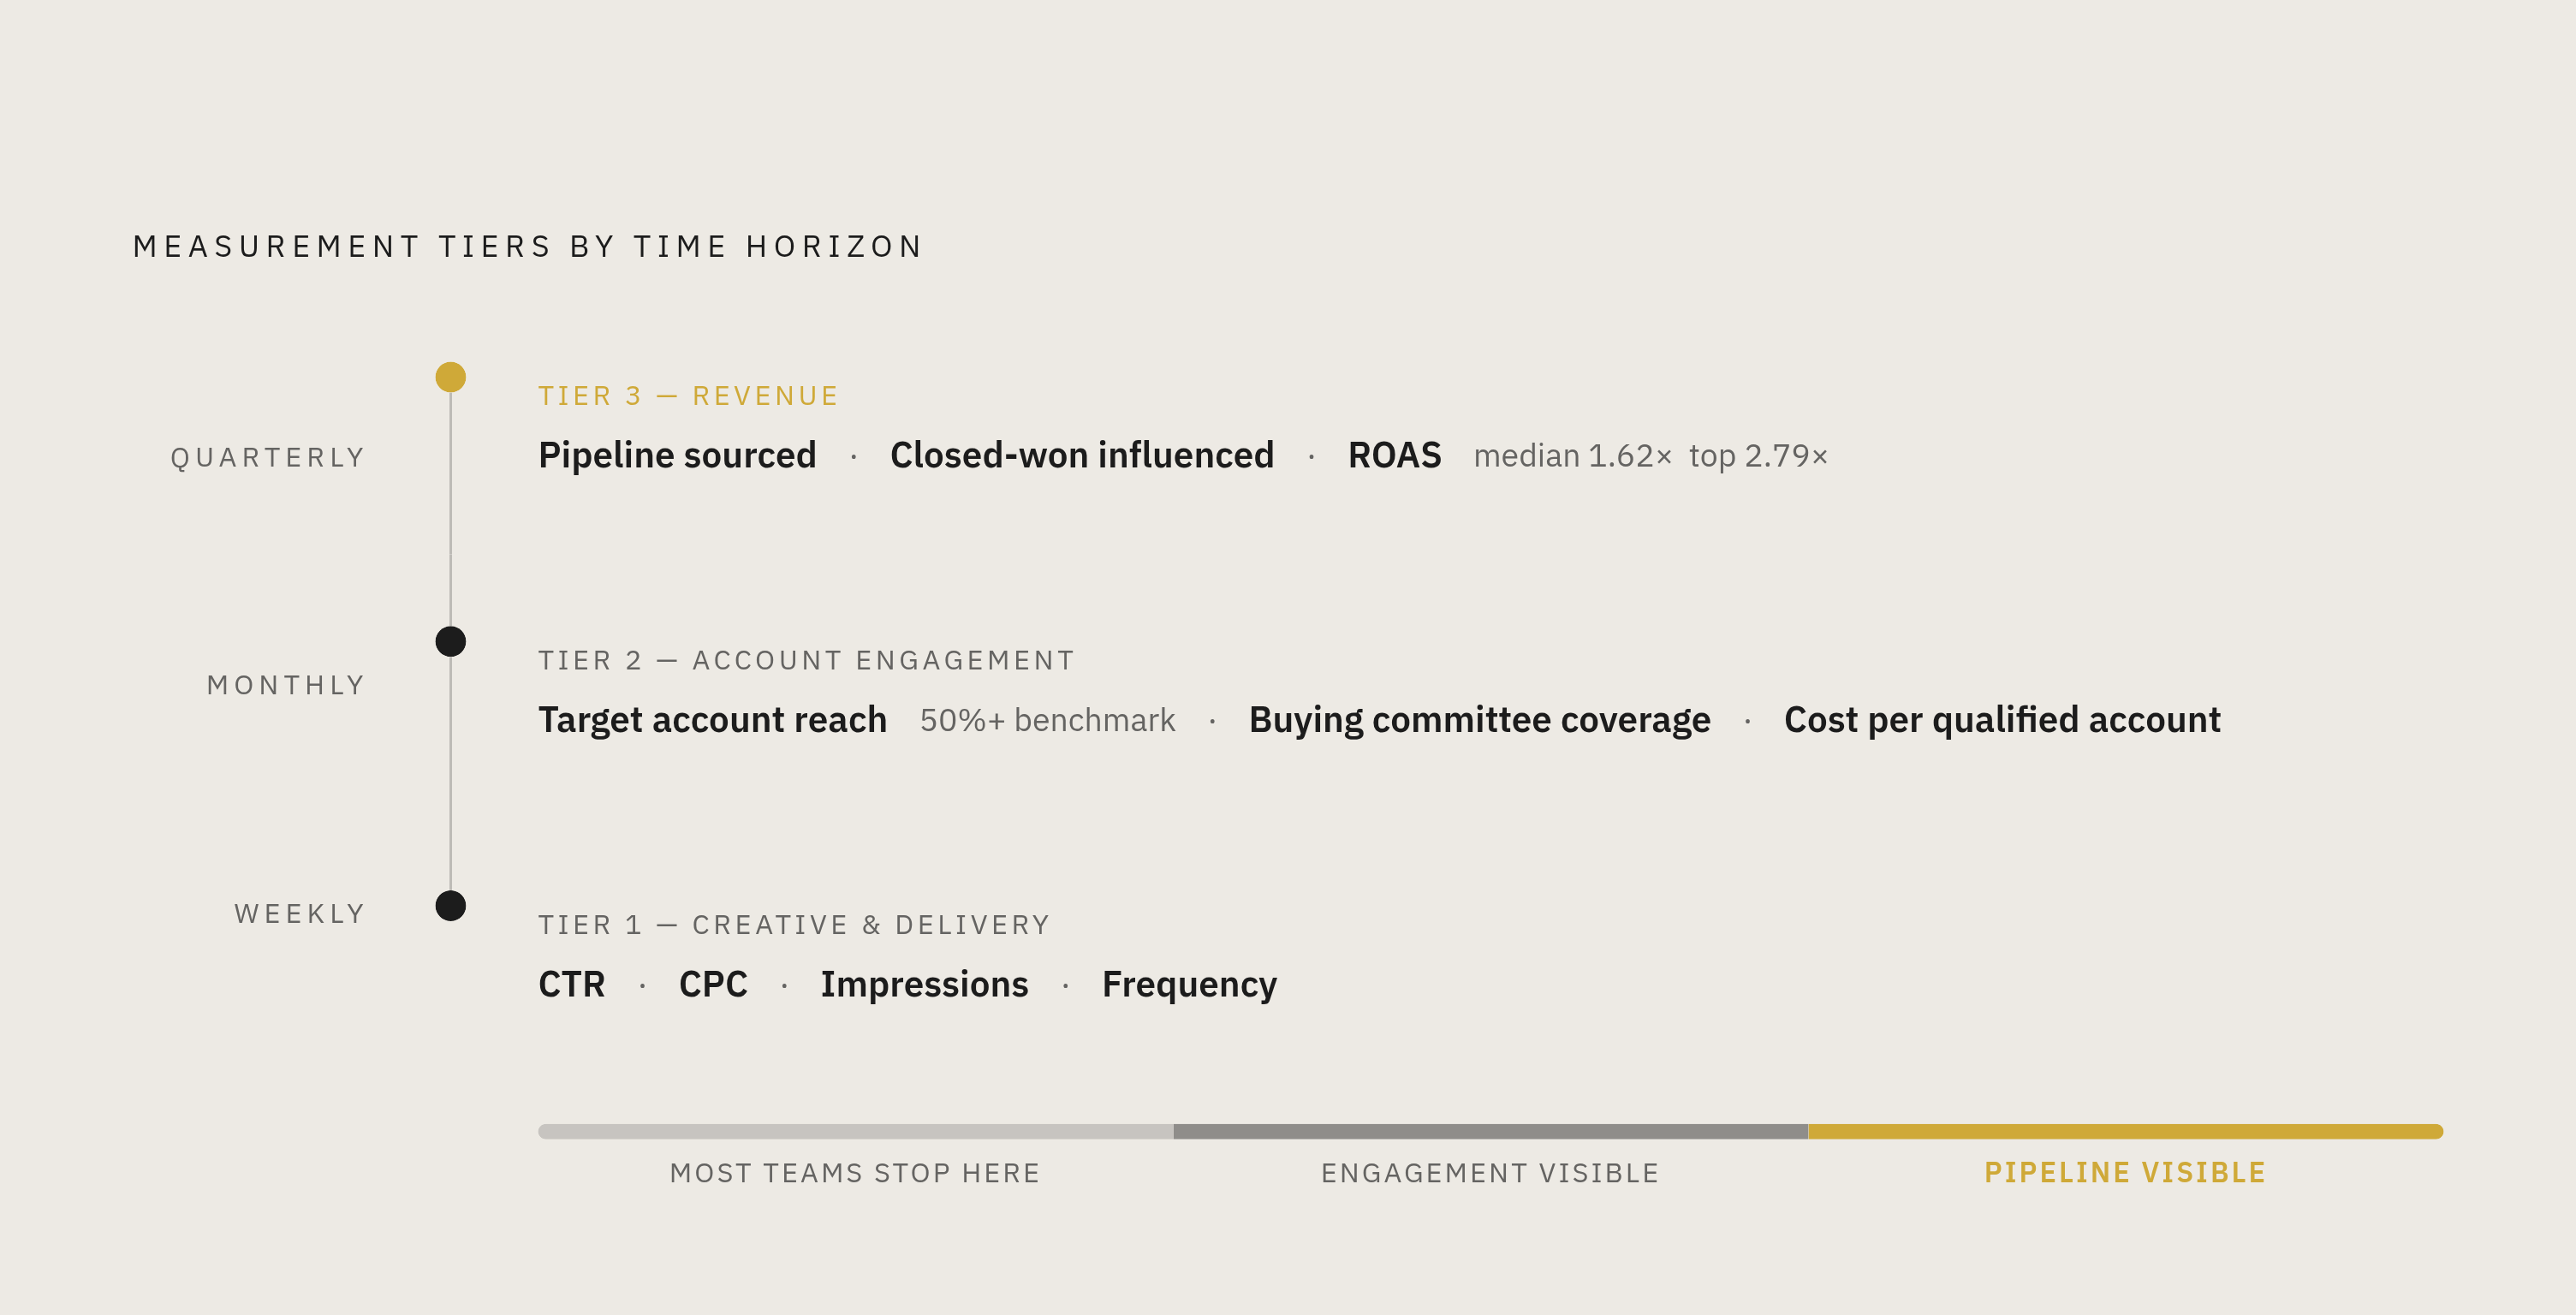
Three tiers. Not one dashboard trying to answer every question at once.
Tier 1 (weekly): creative and delivery diagnostics. Is the ad running? Is the creative working? Is frequency healthy? CTR, CPC, impressions live here. Nowhere else.
Tier 2 (monthly): account-level engagement. Target account reach (that 50%+ mark), buying committee coverage, cost per qualified account reached. This is where "high CTR, wrong audience" gets caught before it burns another quarter of budget.
Tier 3 (quarterly): revenue outcomes. Pipeline sourced, closed-won influenced, ROAS. Needs the CRM connected. No shortcut here either.
That connection is close to non-negotiable, and it's more often missing than you'd think. Per Gartner's 2025 data, most B2B organizations don't even have a formal UTM policy. No UTMs, no CRM link, no Tier 3. That's a discipline problem more than a technical one, which unfortunately makes it harder to fix, not easier.
A clean UTM structure gets you first-touch and last-touch attribution by campaign, format, and audience segment, which is exactly what a position-based model needs underneath it.
The attribution window is a business decision, not a platform default. Match it to your actual sales cycle: 90 days minimum for most mid-market B2B, longer for enterprise.
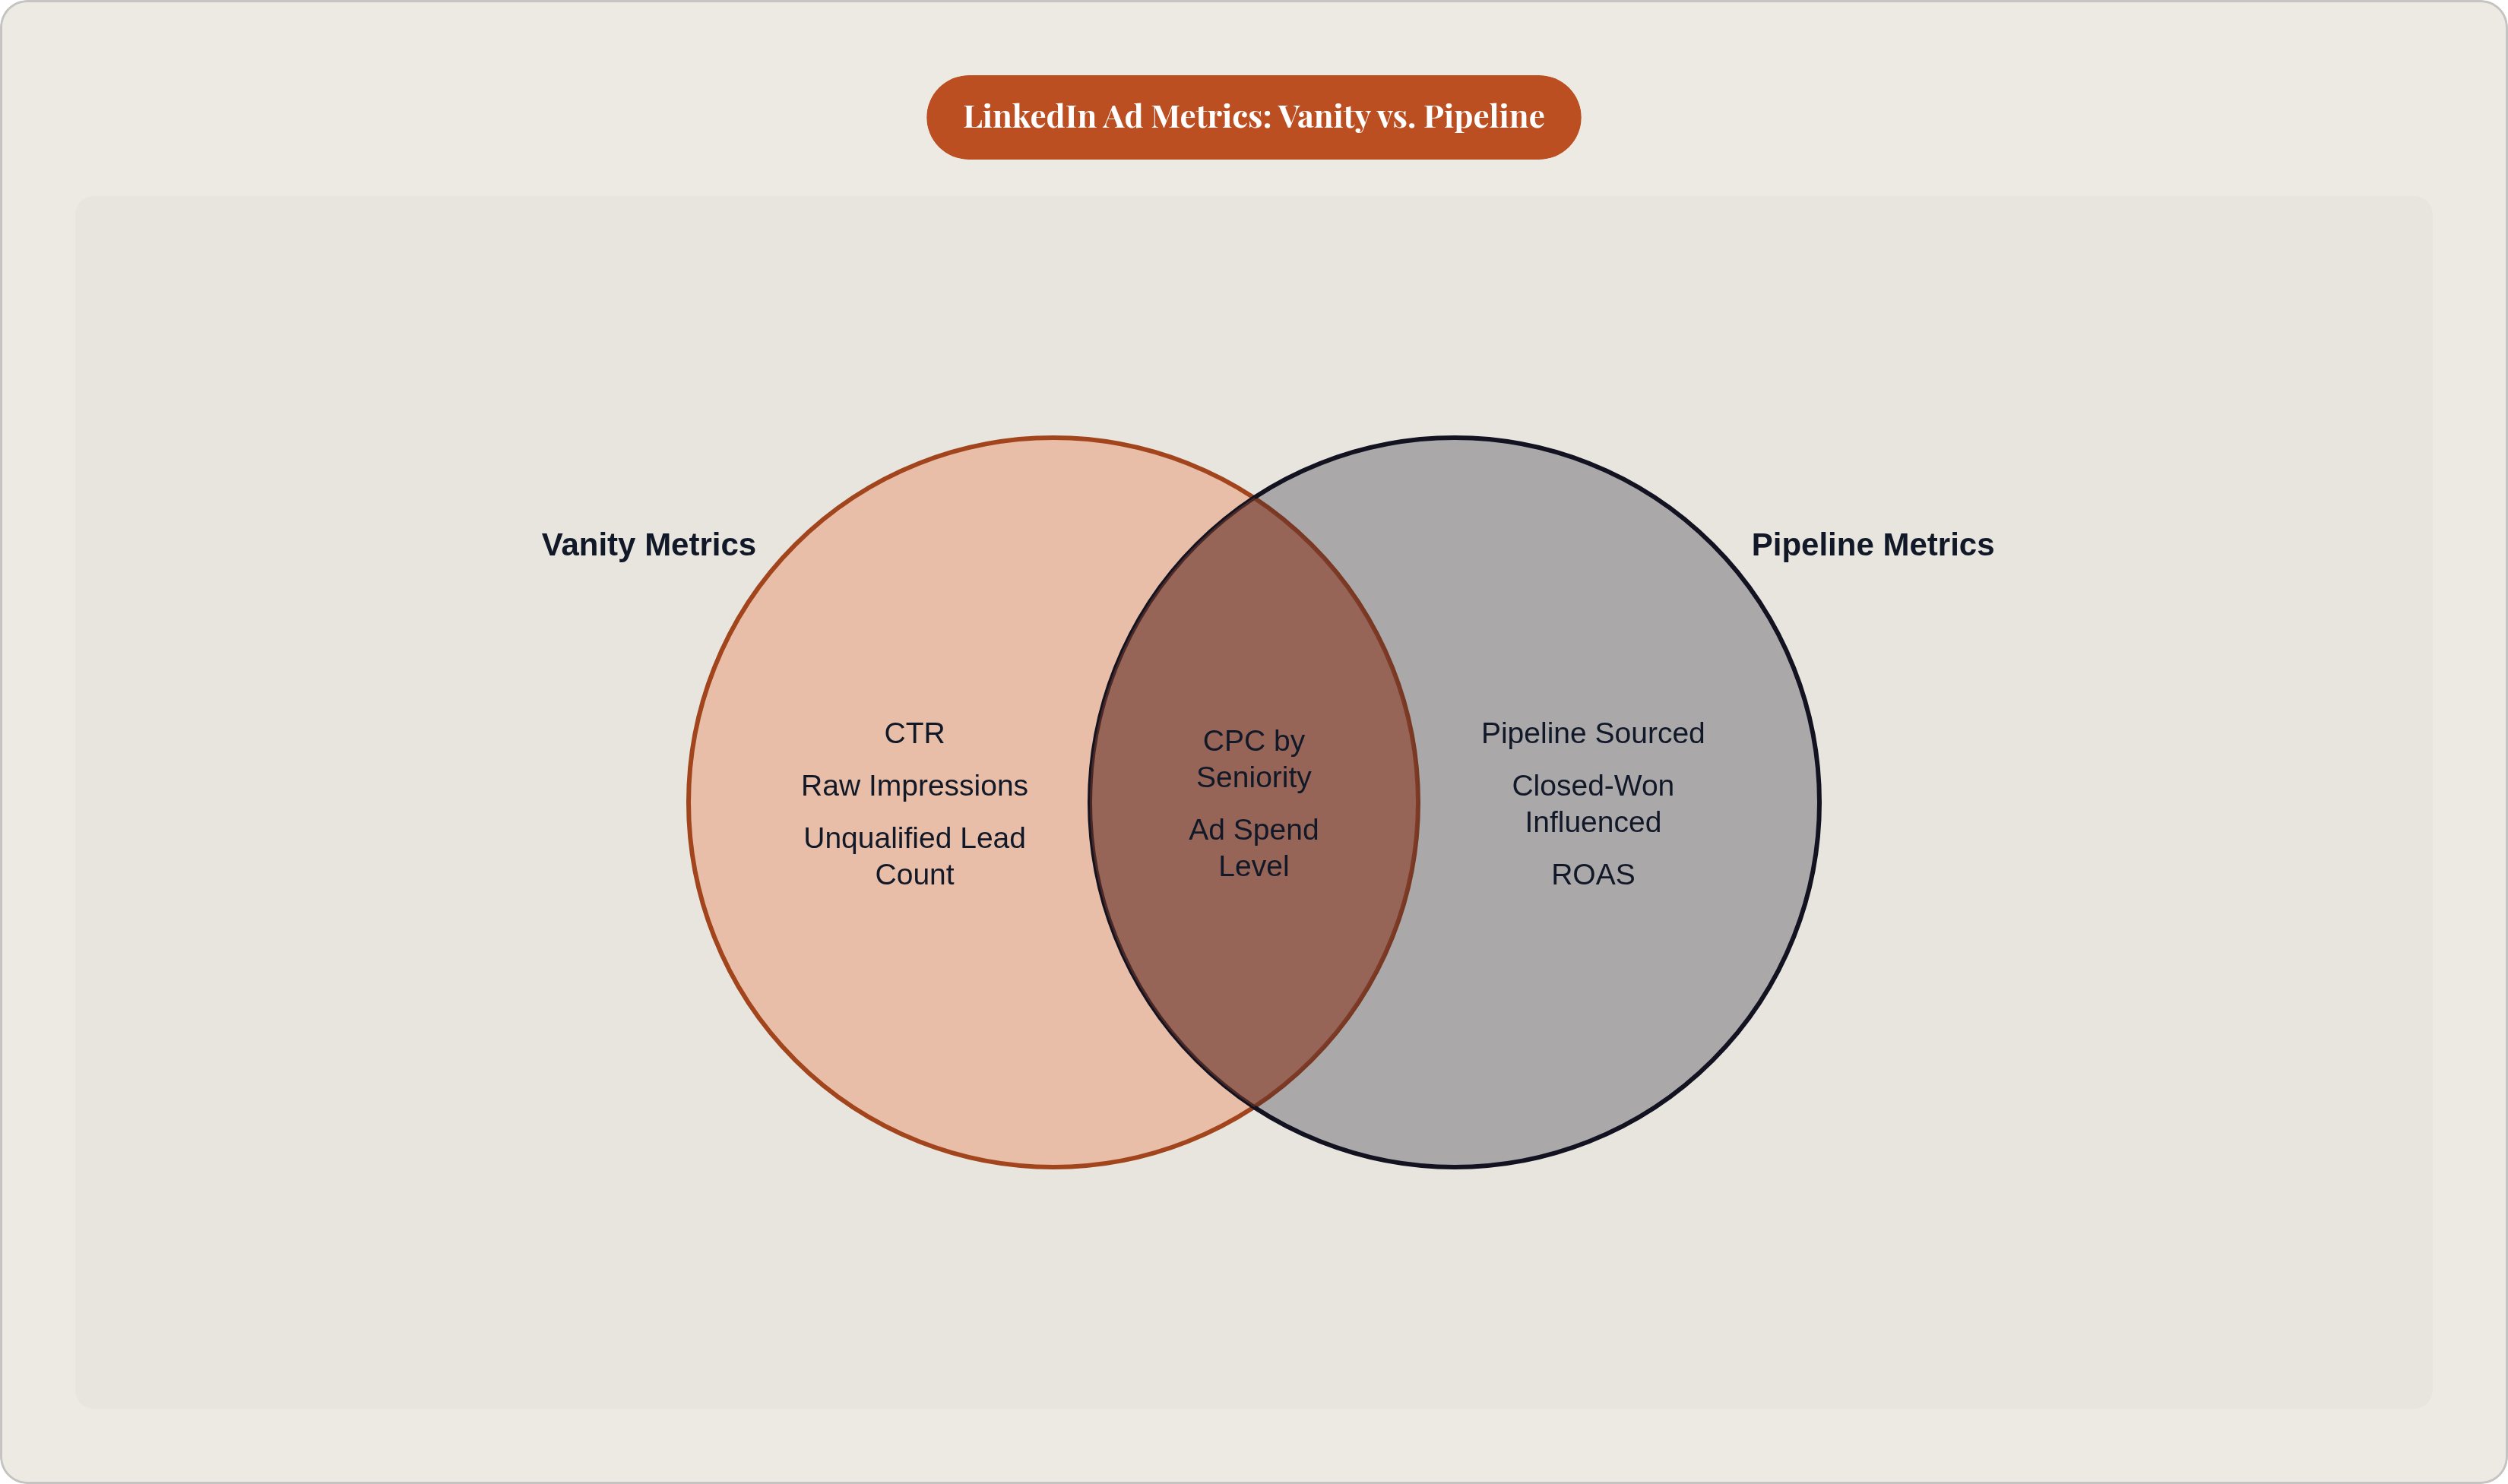
A few things worth cutting from your main report entirely: CTR as a performance signal, raw impressions with no account breakdown, lead count with no ICP qualification attached. Not wrong metrics. Just in the wrong meeting.
If you're running Google alongside LinkedIn, keep them separate in your head, not just your spreadsheet. Google tends to catch people who already know they have a problem and are actively looking for a fix. LinkedIn reaches the much bigger group that isn't searching yet and won't be for months. Blend them into one CPL number and you've erased the fact that they're answering two different questions.
Run this for a few quarters and something useful happens almost by accident: you build a history. Each new campaign starts from evidence instead of a guess. And when something underperforms, you can point at a specific reason, weak targeting, flat creative, a broken landing page, a window that's too short, instead of just nudging the bid up and hoping it works differently this time.