LinkedIn MQL to SQL Conversion Rate Benchmarks for B2B
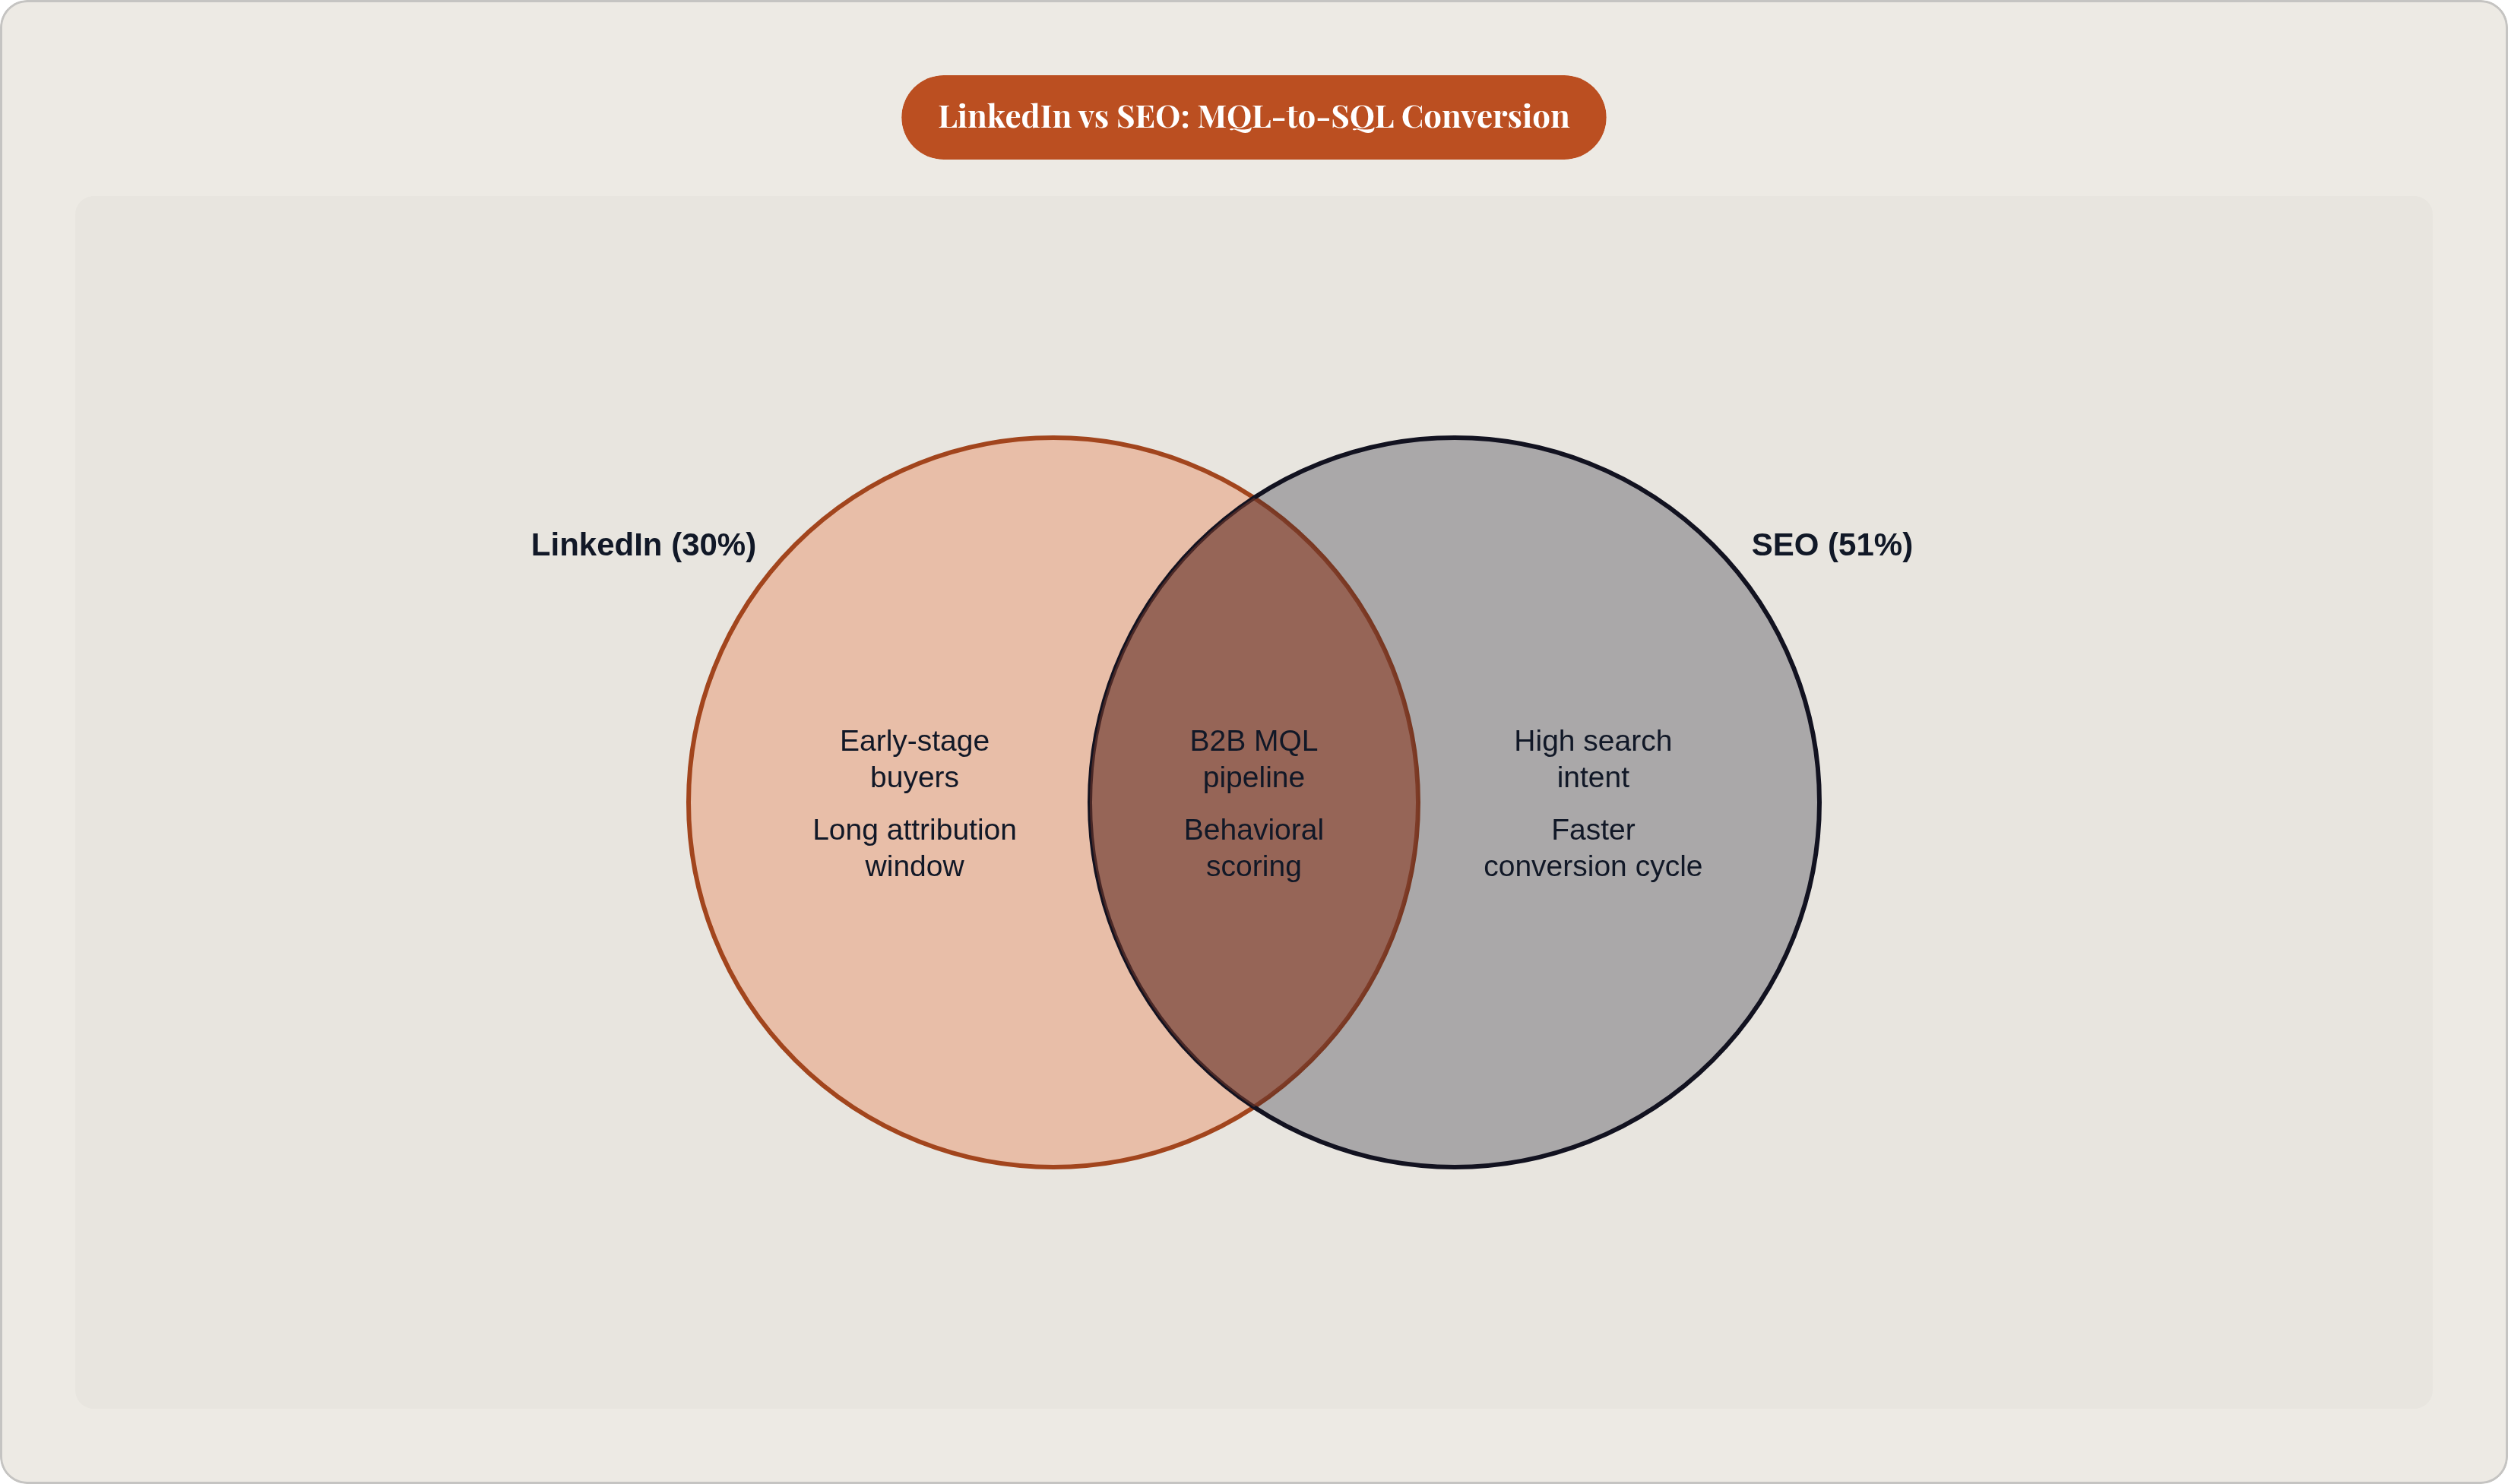
LinkedIn's 30% rate reflects earlier-stage buyer interception, not channel weakness.

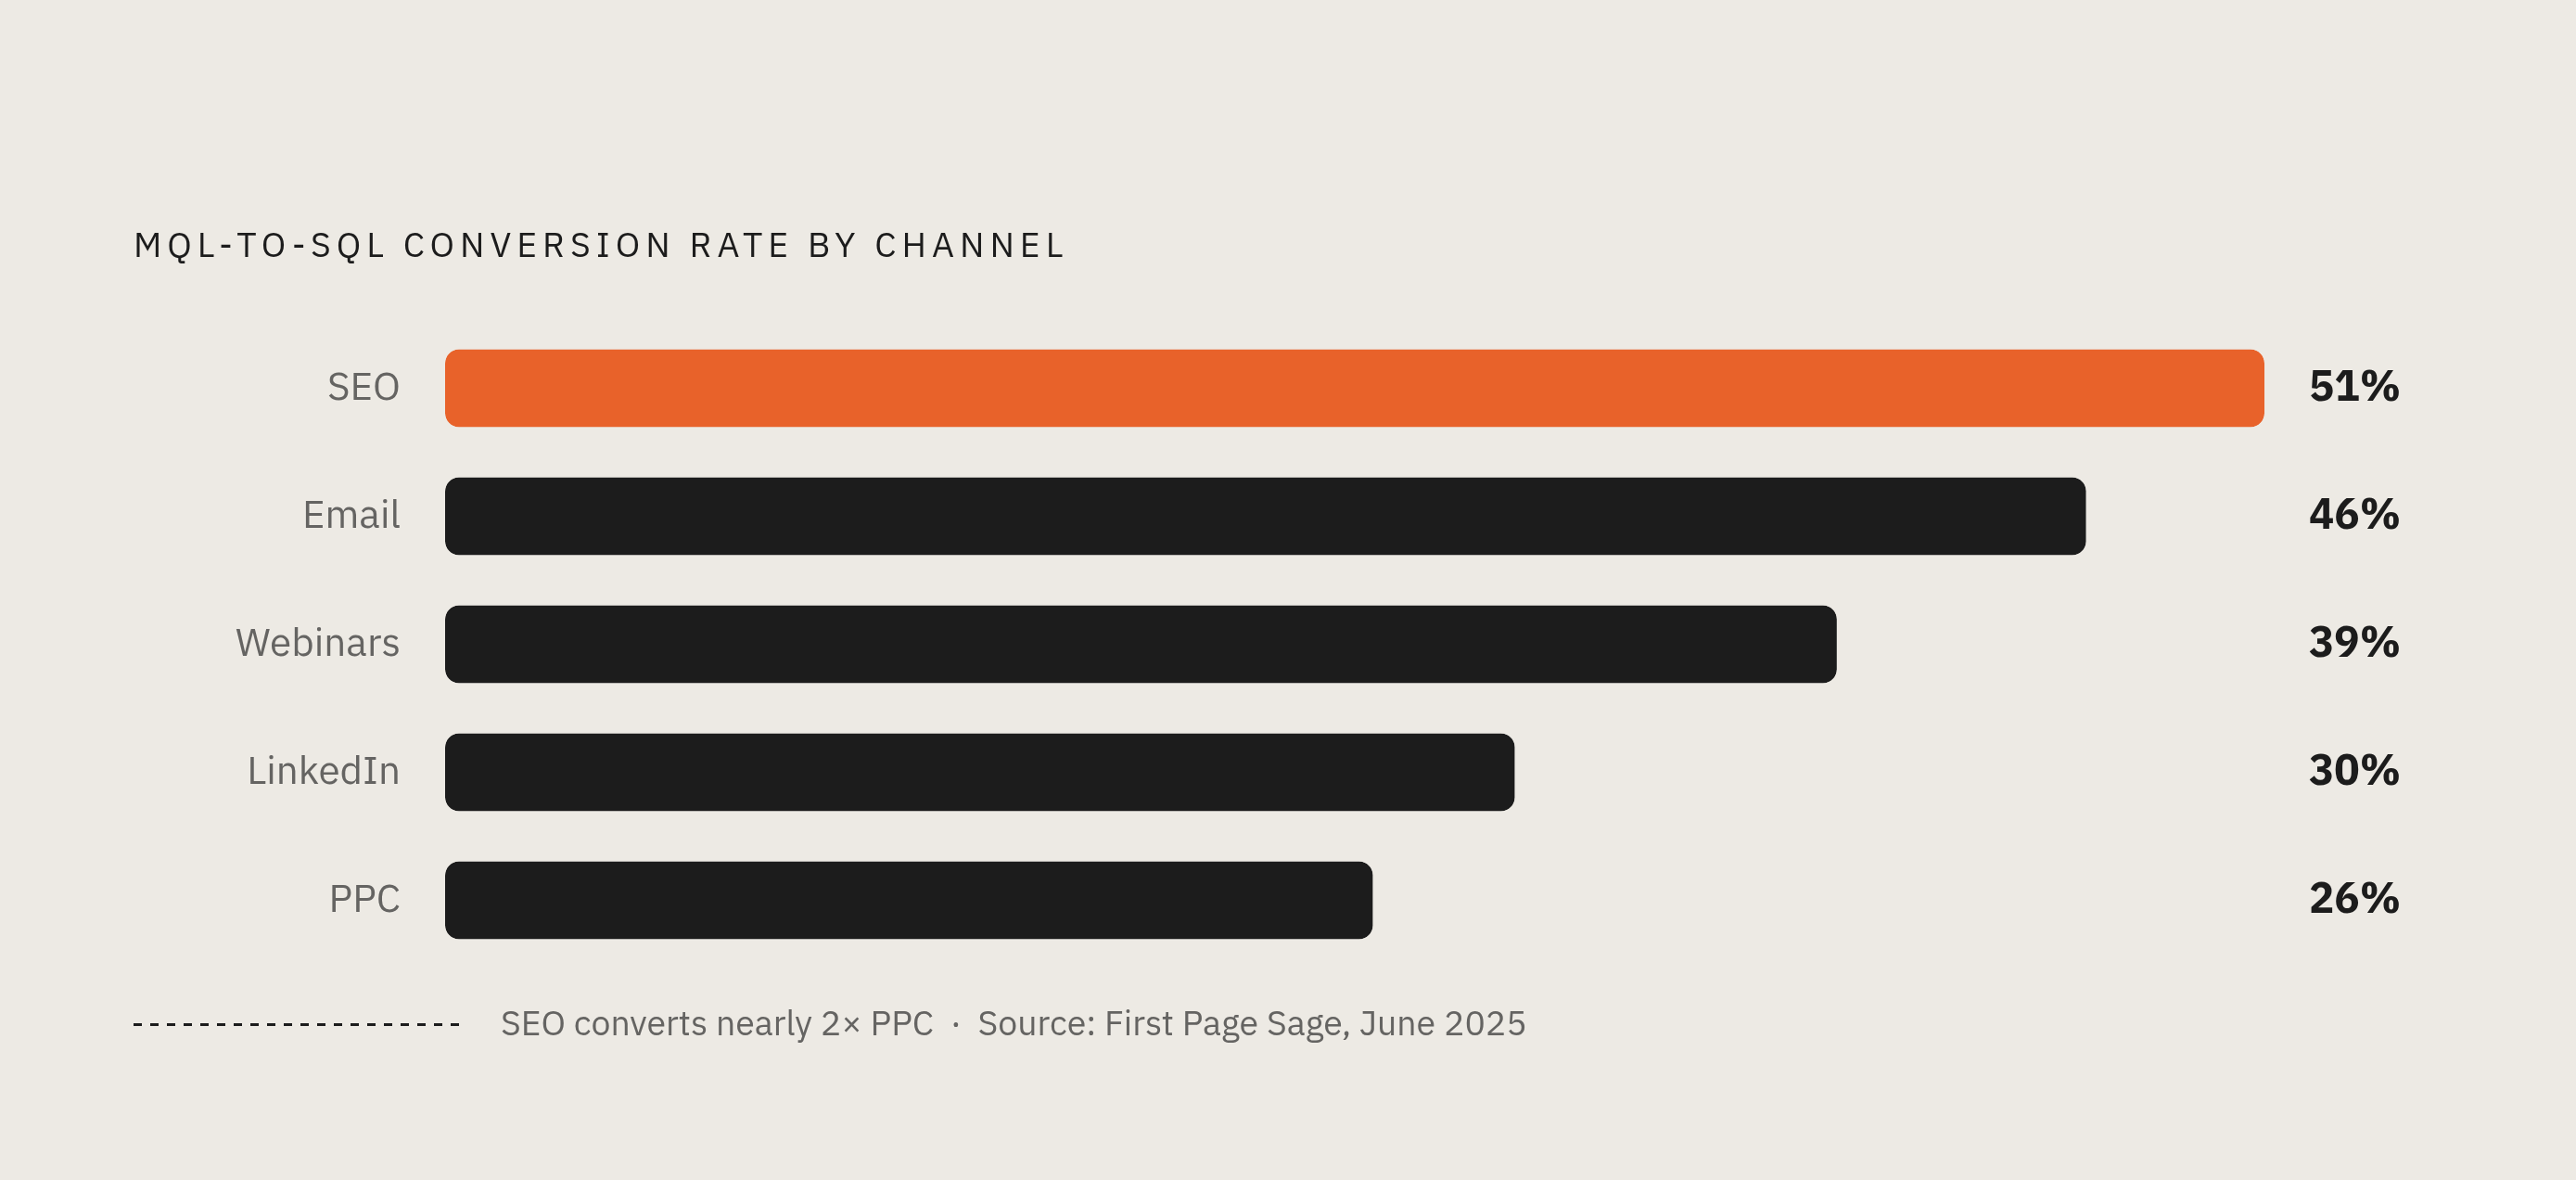
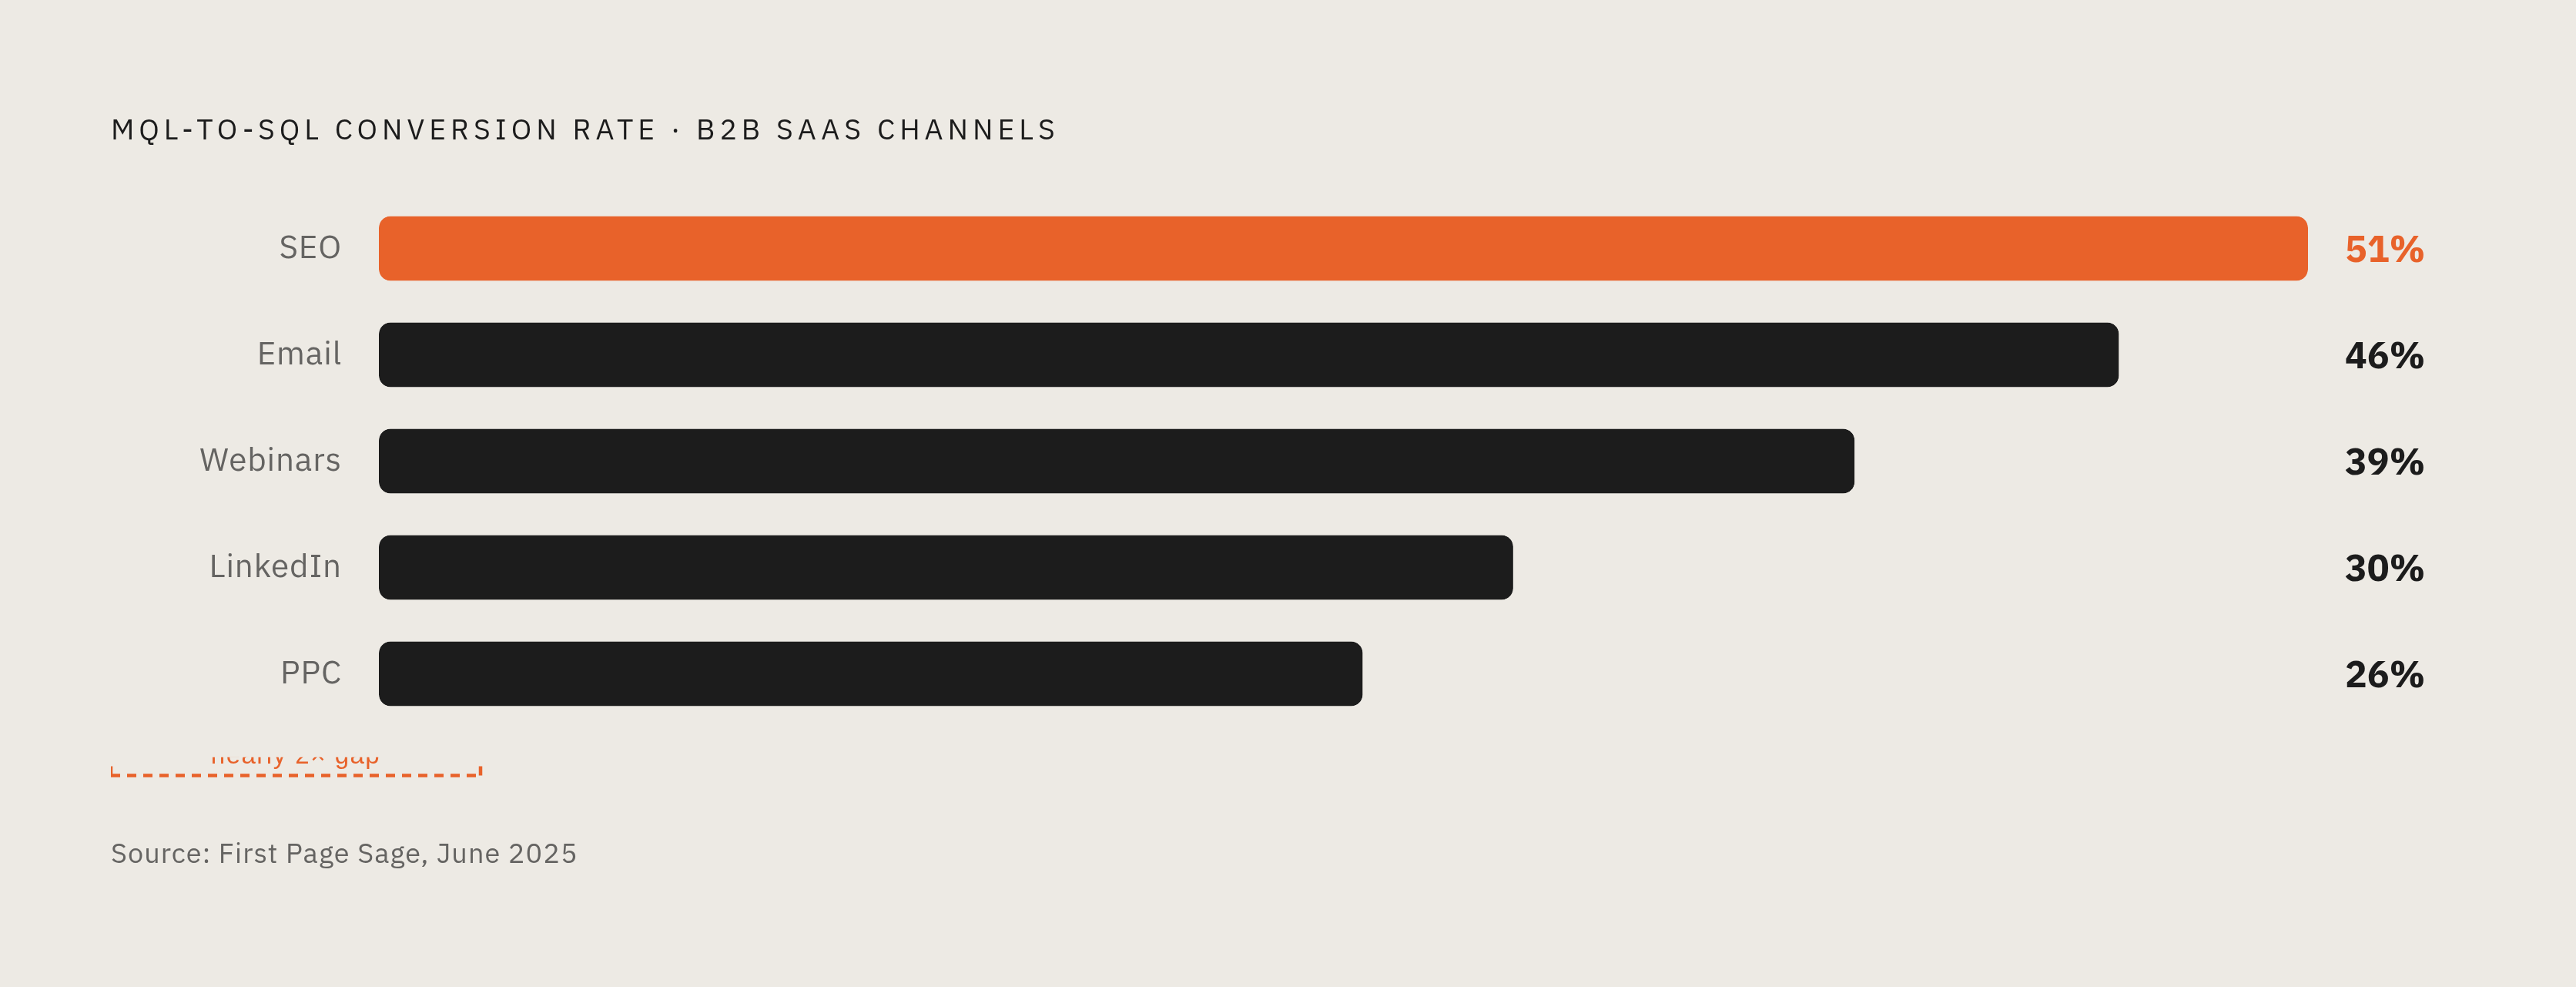
The spread is wider than most people expect. Across B2B SaaS, MQL-to-SQL conversion runs from 26% for PPC to 51% for SEO, per First Page Sage's June 2025 funnel benchmarks. Nearly a 2x difference within the same funnel stage.
Here's the channel breakdown:
Why the spread? Channels with higher intent at point of contact produce leads that convert more readily. SEO captures active problem-solvers who typed a specific question into a search bar. PPC captures clickers who saw an ad. Those are not the same buyer. One showed up looking for something. The other just happened to glance in the right direction — like the difference between a customer who walks into a store knowing exactly what they need and one who wandered in from the rain.
The trap most teams fall into is blending these into a single MQL-to-SQL number. A team shifting budget from SEO to PPC will watch their aggregate rate fall and struggle to understand why, because they're only looking at one number. That's not a marketing problem. That's a measurement problem masquerading as one.
LinkedIn's 30% sits in the middle of the pack, above PPC, below SEO. That makes sense when you think about it. LinkedIn reaches real decision-makers, but it often intercepts them before active search intent has formed. They haven't found a solution yet. They're scrolling.
Source-level MQL-to-SQL tracking isn't optional if you want benchmarks to mean anything. It's the starting point.
Where LinkedIn's 30% MQL-to-SQL Rate Comes From and What It Actually Reflects
LinkedIn has over a billion members globally, with more than 65 million decision-makers actively on the platform. The targeting precision is real. And according to LinkedIn's own 2025 B2B Benchmark Report, 89% of B2B marketers credit it as their top channel for generating qualified leads.
But qualified leads and high-converting leads are not the same thing. That distinction is worth sitting with for a second.
LinkedIn's 30% MQL-to-SQL rate is structurally lower than SEO's 51% for a specific reason. LinkedIn intercepts buyers earlier in their journey, often before they've even recognized they have a problem worth solving. Gartner research puts the majority of the B2B buying journey in a "dark period" before a prospect ever talks to sales. LinkedIn often catches people there.
That's not a failure. It's a characteristic of the channel — the way a river's current is just a fact of geography, not a flaw in the water. It just demands a different nurture approach before handoff.
And within that 30%, there's real variation depending on format and offer:
- Thought Leader Ads drive a disproportionate share of conversions relative to spend. ZenABM's 2026 report puts their cost per conversion at roughly half that of standard cold traffic.
- Gated content formats like ebooks and webinar registrations are declining sharply in performance. Buyers now prefer ungated, in-feed value, per Factors.ai's B2B Benchmark Report 2025.
A LinkedIn MQL from a Thought Leader Ad served to a retargeting audience is a fundamentally different lead than one from a cold ebook download. The 30% blends both. So the real question is: which one are you actually generating?
The Full B2B Funnel Context That Makes MQL-to-SQL Rates Interpretable
One stage in isolation can be misleading. Here's the full B2B pipeline progression, per MarketJoy data:
MQL-to-SQL is the bottleneck. 2025 B2B SaaS funnel data puts the average at 15–21%, and improving this stage by five percentage points can lift revenue by up to 18%. That's a real lever, not a rounding error.
Company size also changes the shape of the funnel, not just the rates:
- Small-to-midsize ($10M–$100M ARR): MQL-to-SQL around 39%, overall lead-to-customer near 2.7%. A relatively efficient middle of funnel.
- Enterprise ($1B+ ARR): The bottom gets harder. Opportunity-to-close drops significantly compared to smaller firms. Longer sales cycles and more stakeholders compress close rates even when the top of funnel looks healthy.
Here's the downstream piece that makes this especially relevant for LinkedIn. LinkedIn MQLs at 30% look modest mid-funnel. But that comparison only holds if you're tracking what happens when those leads reach SQL and opportunity stages. PPC leads convert at 26% MQL-to-SQL but can recover downstream with stronger opportunity-to-close rates depending on the product and sales motion. Channel comparison requires full-funnel visibility. A single-stage snapshot will often lead you to the wrong conclusion.
Optimizing MQL-to-SQL without tracking what happens to those SQLs later can create locally good numbers that don't actually move pipeline. Winning the battle and losing the war.
How LinkedIn's Conversion Timeline Differs From Other Channels and Why That Trips Up Reporting
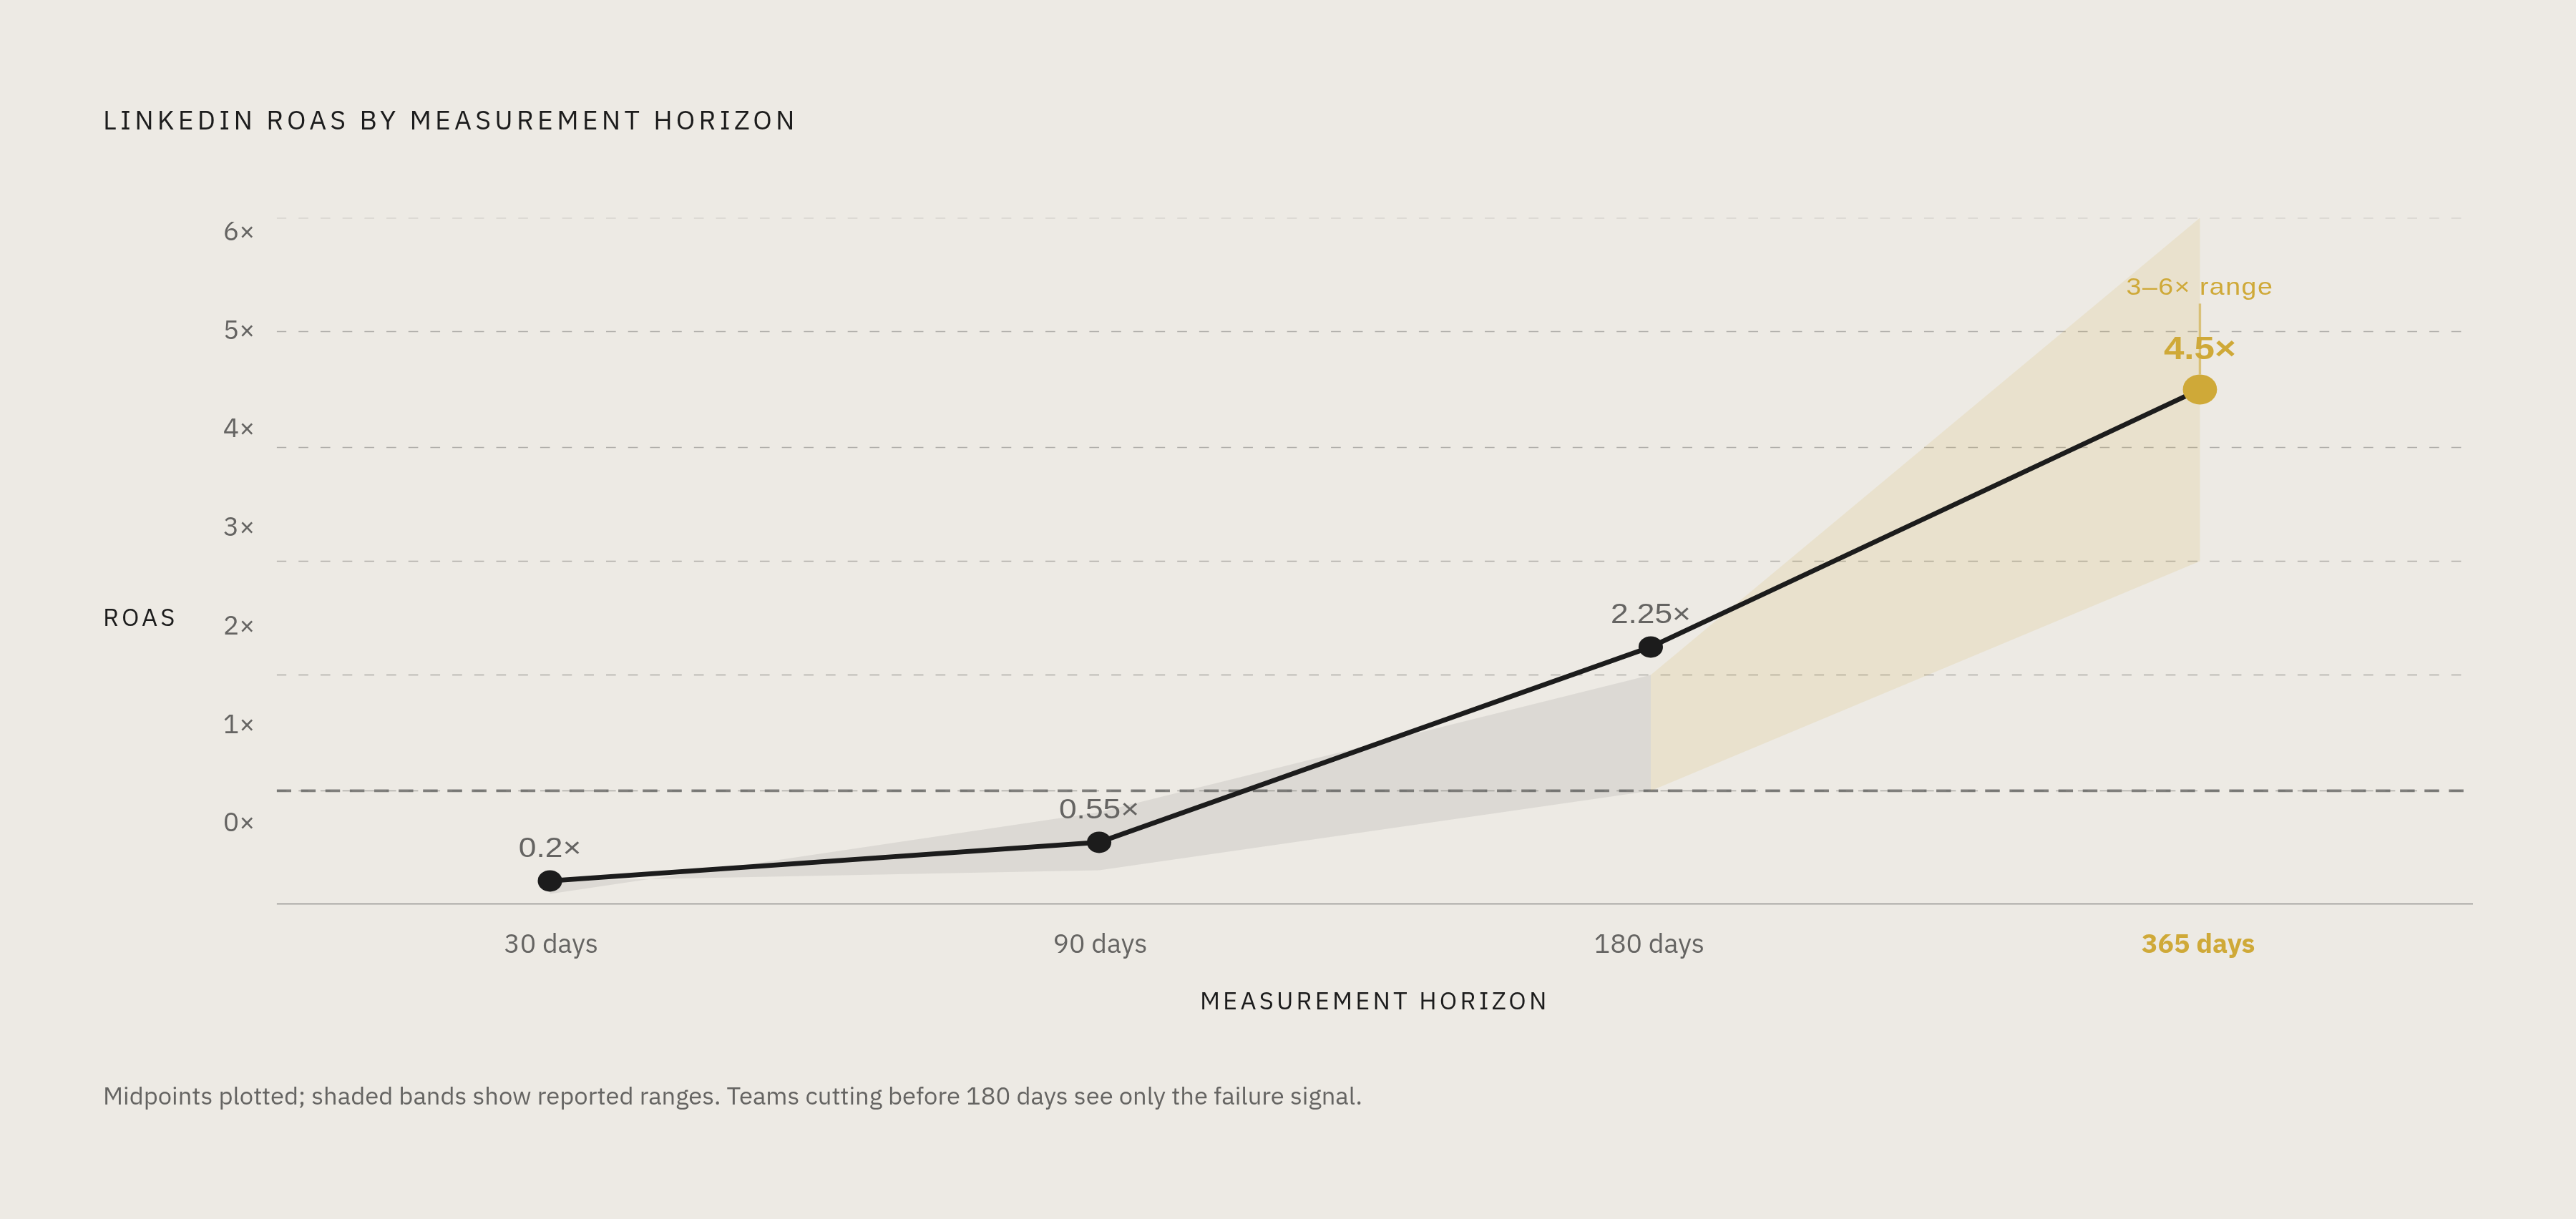
LinkedIn MQL conversion cycles are longer and quarter-dependent in ways that create a systematic measurement problem. Most teams stumble here not because they're bad at math, but because they're using the wrong window.
- Q1: Average 24-day MQL conversion cycle. High-intent, budget-flush buyers moving fast.
- Q2: Lengthens to 45 days. MQLs spill into Q3, creating a pipeline bridge that looks weak in-quarter.
- Q3: Extends to 62 days. Important for second-half pipeline but easy to misread as poor performance mid-cycle.
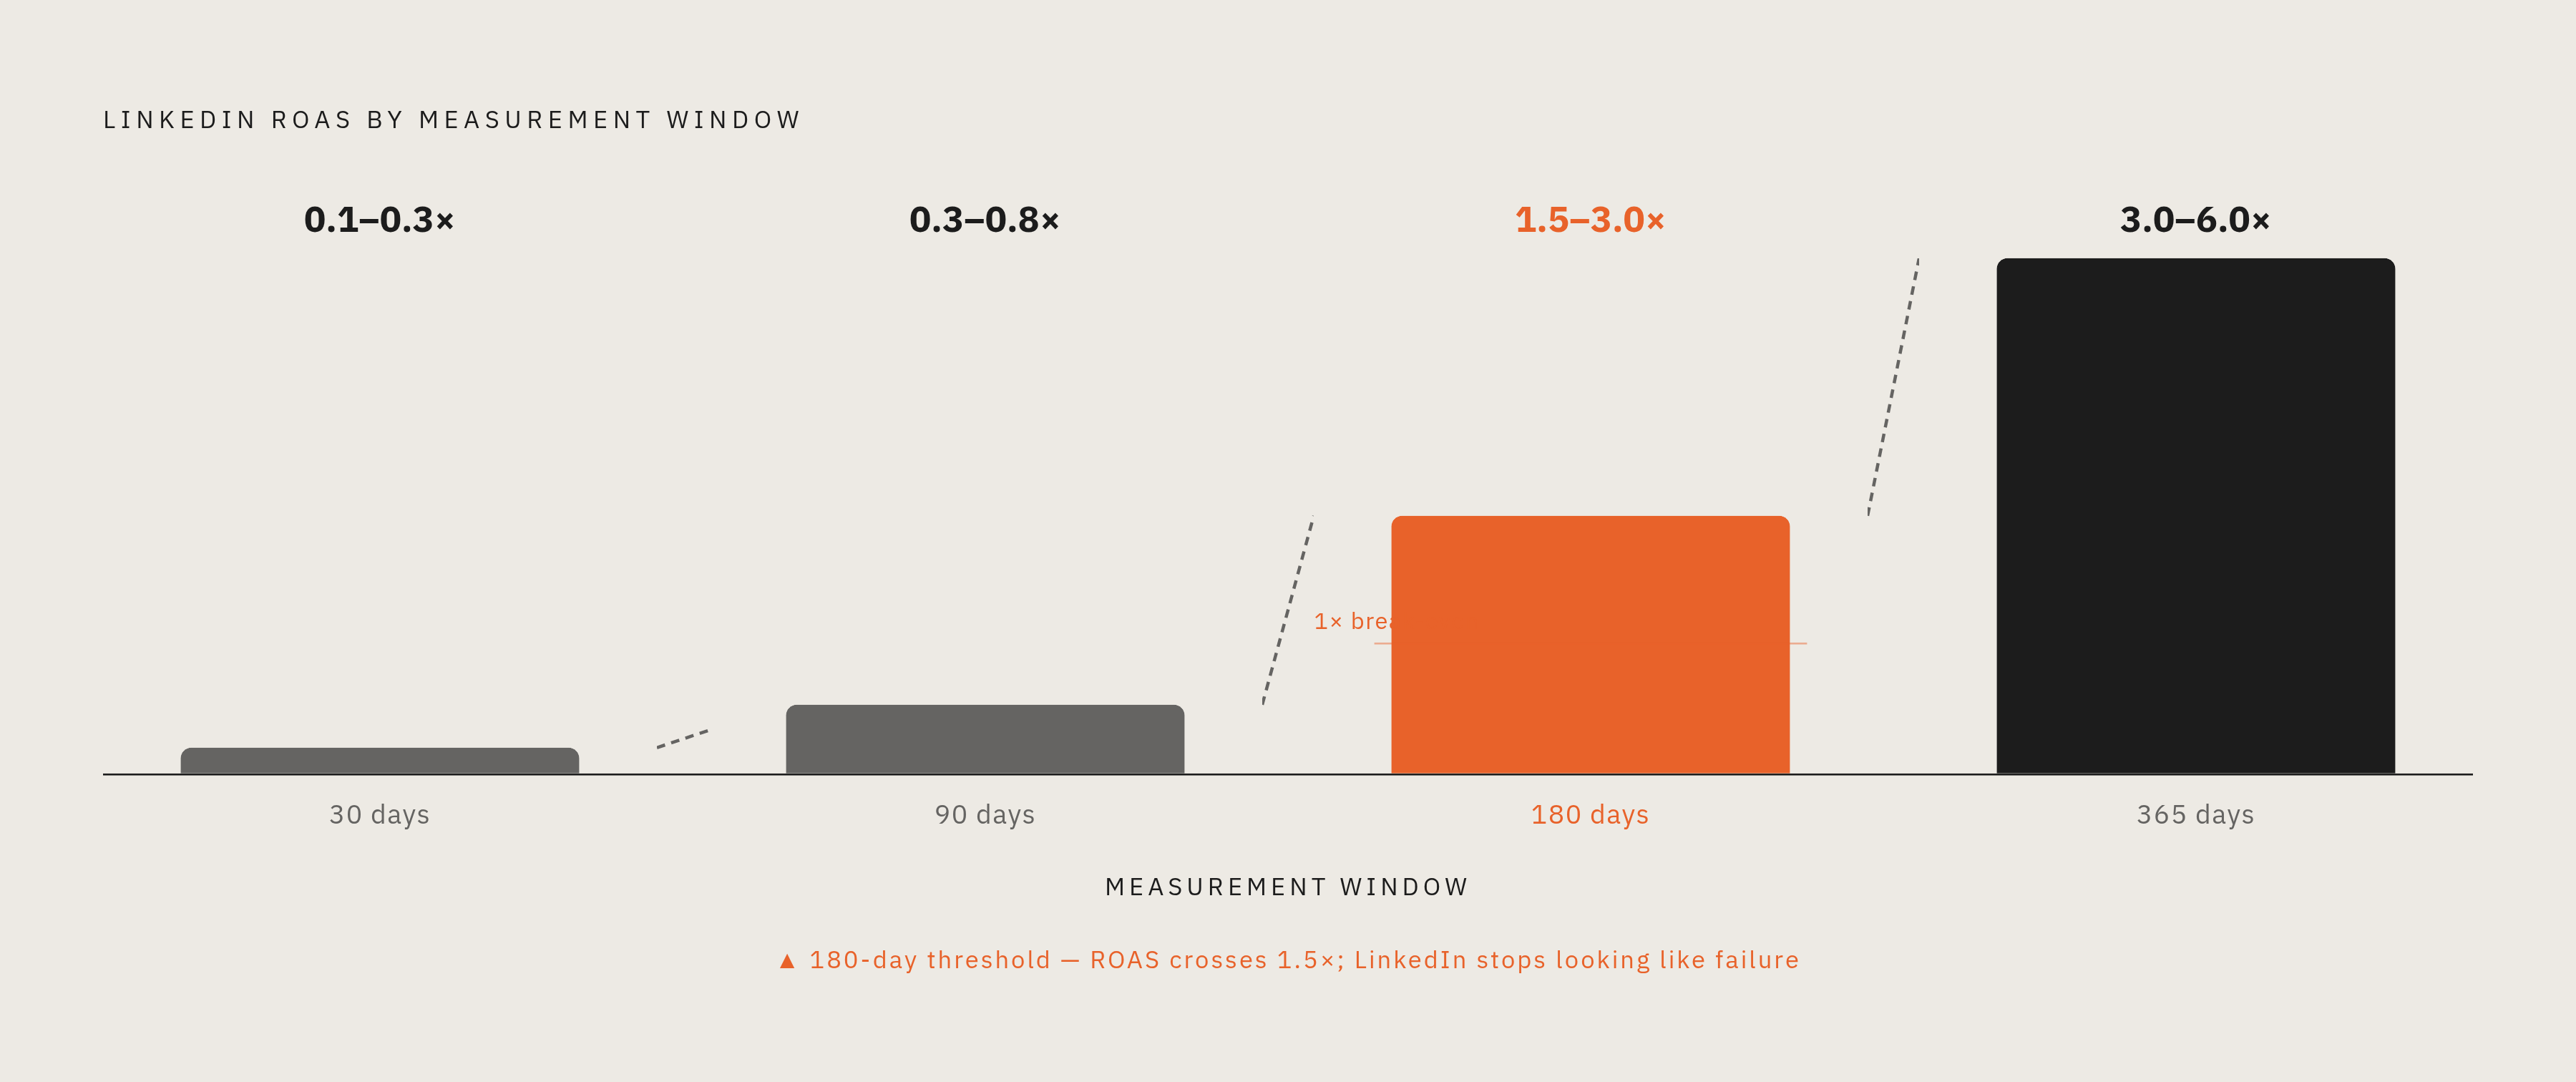
The ROAS timeline makes this structural problem concrete:
- 30-day ROAS: Often 0.1–0.3x. Looks like failure.
- 90-day: 0.3–0.8x. Still below breakeven.
- 180-day: 1.5–3.0x. Real performance starts showing up.
- 365-day: 3.0–6.0x. This is where LinkedIn's actual advantage becomes clear.
Teams that measure LinkedIn MQL-to-SQL in 30-day windows are systematically undervaluing the channel and often cutting programs right before they would have compounded.
Compare that to Google Ads, which captures in-market demand immediately. Faster MQL-to-SQL, shorter attribution window. But it only reaches the 3–5% of your total addressable market that is actively searching right now. LinkedIn reaches the vast majority earlier in their journey. Those are different jobs. Measuring them on the same timeline is like judging a marathon runner by their sprint time — the conclusion feels rigorous but isn't.
The right measurement window for LinkedIn aligns to sales cycle length, not marketing quarter. A 90-day enterprise sales cycle needs at least a 180-day reporting horizon before you can reliably evaluate LinkedIn performance. Anything shorter is looking at incomplete data and calling it a verdict.
What Separates a LinkedIn MQL Worth Passing to Sales From One That Inflates Your Funnel
Only about 2% of B2B website visitors fill out forms. If MQL criteria are too loose, teams are calling that 2% "qualified" without evidence of real intent. That inflates the MQL count and eventually tanks the conversion rate. And it frustrates sales, who eventually stop trusting the list entirely.
The distinction that matters most is behavioral scoring versus demographic scoring.
Demographic scoring tells you who someone is: title, company size, industry. Useful for targeting, but it doesn't tell you whether they're buying. B2B SaaS companies using behavioral scoring models achieve MQL-to-SQL conversion rates in the high 30s to 40% range, well above the 13% all-channel average. The behavioral signals that actually matter are content consumption patterns, return visits, and engagement with specific offer types. A single form fill from someone who wanted the PDF doesn't qualify.
Offer type functions as a quality filter too:
- Inbound demo requests convert at roughly 20x the rate of content download leads toward revenue.
- A LinkedIn lead gen form behind a checklist download is not the same MQL as one behind a product demo request.
Treating them identically destroys conversion rate accuracy. And it makes the 30% benchmark meaningless, because you're averaging across lead types that behave completely differently.
Speed is a multiplier most teams underestimate. Following up within the first hour increases MQL-to-SQL conversion rates to 53%. Same lead, same score, dramatically different outcome depending on response time. That's an operational issue, and it's fixable.
Tighter ICP definition upstream makes intent signals downstream more reliable. Broad targeting produces broad MQLs, and your 30% conversion rate becomes a ceiling rather than a floor.
How Teams That Consistently Hit Pipeline Targets Actually Use LinkedIn Benchmarks
They don't chase MQL volume. They track MQL-to-SQL velocity by source and by offer type. Aggregate conversion rate is a lagging indicator. Source-level velocity tells you what's actually working before the quarter closes.
Channel sequencing matters more than channel selection:
- Google Ads for demand capture. Reaches the 3–5% of TAM actively in-market. Faster MQL-to-SQL cycles, shorter attribution window.
- LinkedIn layered on once Google opportunity is maximized. Reaches the broader market earlier in the journey, longer conversion horizon.
- LinkedIn remarketing audiences seeded with Google Ads traffic. The two channels compound each other rather than compete.
Factors.ai's 2025 data shows LinkedIn generating a 44% revenue return advantage over Google and 31.7% budget growth versus 6% for Google. That reflects a market shift toward longer-cycle, account-level influence. But the teams that abandoned Google entirely gave up high-intent capture in the process. Both channels have a job, and the job is different.
Multi-touch sequences combining LinkedIn, email, and phone generate significantly higher meeting rates than single-channel efforts, per Outreach research. MQL-to-SQL conversion improves when LinkedIn isn't doing the heavy lifting alone.
Intent data changes the response model. The highest-converting teams respond to buying signals within 48 hours. LinkedIn engagement, ad clicks, content views, and profile visits can trigger coordinated sales outreach rather than just sitting in a lead gen queue. That reframes LinkedIn from a passive lead source to an active signal layer.
Measurement discipline at the operational level means tracking three separate cuts on the same data: MQL-to-SQL by channel, MQL-to-SQL by offer type, and MQL-to-SQL by quarter. Each reveals different problems. Blending them hides all of them.
Where AI-Driven Campaign Execution Changes the MQL-to-SQL Equation
The conversion improvements documented across this piece — behavioral scoring reaching the high 30s-40% range, speed-to-follow-up driving 53% conversion — require continuous optimization. The kind that degrades fast when run manually at scale. At some point, the spreadsheet can't keep up with the signal volume.
AI-driven execution operates directly on the variables that move MQL-to-SQL most. Audience segmentation and ICP tightening feed LinkedIn's algorithm better signals upstream, so the leads coming out the other end are closer to the buying profile. Creative iteration happens continuously rather than quarterly. Attribution runs at the source level, not blended, and feeds back into campaign decisions in something closer to real time.
The compounding logic is what makes this worth paying attention to. Every campaign run with full-stack attribution produces better audience data, better negative targeting, and better creative signals for the next one. The 30% LinkedIn benchmark is a starting point, not a ceiling, for programs that actually learn from themselves.
Thunder Agent OS runs Google and LinkedIn ads end to end for sales-led B2B teams, with MQL-to-SQL conversion as the pipeline outcome it optimizes toward. Not impressions. Not form fills. Weekly reporting makes source-level conversion data transparent rather than buried in a blended dashboard.
That last point matters because blended numbers are where accountability goes to disappear. If the benchmark you're measuring against was produced by programs without source-level visibility, without behavioral scoring, and measured in 30-day windows, you should ask what you're actually comparing yourself to.
The 30% LinkedIn MQL-to-SQL rate is an accurate description of average performance. The teams that treat it as a ceiling to push through rather than a target to accept are the ones who show up differently in pipeline reviews. Getting there requires knowing which variables to pull, in which order, and actually having the operational capacity to act on what you find.


