LinkedIn Ads CPM Benchmarks by Audience Segment and Objective
LinkedIn CPM varies wildly based on who you target, audience size, and what you're optimizing for.

LinkedIn ads CPM benchmarks are what this piece maps out, and the angle is simple: there's no single correct number, because CPM on LinkedIn is an auction price that moves with audience seniority, audience size, and campaign objective all at once. Ask ten accounts what they pay and you'll get ten different answers, and all ten could be right for their own setup. LinkedIn publishes no official cost benchmarks, so every figure in industry reports comes from third-party aggregators, and they measure only their own customer books of business. Customer mixes differ, and so do measurement methods, and that is why published ranges stretch from single-digit CPMs up past a hundred dollars. A marketer who grabs an industry average off a slide and treats it as a budget target is very likely planning against the wrong number for their specific ICP and objective. The number that matters is the one produced by three variables interacting at once: who gets targeted (seniority), how many of them exist (audience size), and what LinkedIn is being asked to optimize toward (objective).
How audience seniority sets the CPM floor
Seniority is the single biggest price multiplier in the LinkedIn auction. Target C-suite executives and expect to pay roughly two to three times more per thousand impressions than targeting manager-level audiences, even when every other setting stays the same. Why does title alone move price that much? Because the auction works like any other: a lot of advertisers want the same small pool of senior titles in the same region, and bids escalate accordingly, regardless of how large the broader audience pool is. A manager-level audience spreads demand across more people who compete for the same ad slots, but a C-suite audience concentrates that same advertiser demand onto a much thinner slice of LinkedIn's membership.
That mechanism plays out concretely in a cybersecurity campaign that shifted targeting from C-suite only to Director-plus. Broadening the seniority floor substantially expanded the available audience, and cost per lead dropped meaningfully as a result. Lead quality held up, because Directors are key influencers in security purchasing decisions, and they are not passive bystanders in the buying committee. The exact floor chosen (C-suite versus Director-plus versus manager) is itself a lever, and moving it down one rung can unlock real savings while keeping the people who actually shape the deal.
Audience size and the penalty below a tens-of-thousands member threshold
Seniority sets a floor, but audience size pushes on price from a second direction. Once a targeted audience drops below a threshold of roughly tens of thousands of members, delivery gets erratic and CPM spikes, because the campaign keeps showing ads to the same small pool over and over. That's a structural fact about how the auction allocates impressions, not a sign that the creative needs work.
Budget pressure makes this worse, and the two effects compound rather than simply add. Kiin Labs ran a paired comparison that makes the mechanism visible: a lower daily spend relative to audience size, the kind of ratio typical when the audience runs large, produced a CPM of $39.57. Push that same spend into a much smaller audience, so the daily budget presses harder on a thinner pool, and CPM roughly doubles. Same dollars, smaller audience, nearly double the price per thousand impressions. Audience size doesn't just set a baseline cost. It determines how much room a budget has to breathe before it starts bidding against itself.
The fix for this is tactical rather than strategic: layer seniority with broader skill or interest targeting instead of stacking narrow filters on top of each other. Targeting "Marketing" as a skill plus "Director and above" as a seniority floor reaches a meaningfully larger pool than targeting the exact job title "VP of Marketing," while keeping the audience just as relevant to the pitch. Widening the pool this way reduces the auction pressure that drives CPM up, while keeping the people who were the actual target.
How campaign objective shifts CPM across the funnel
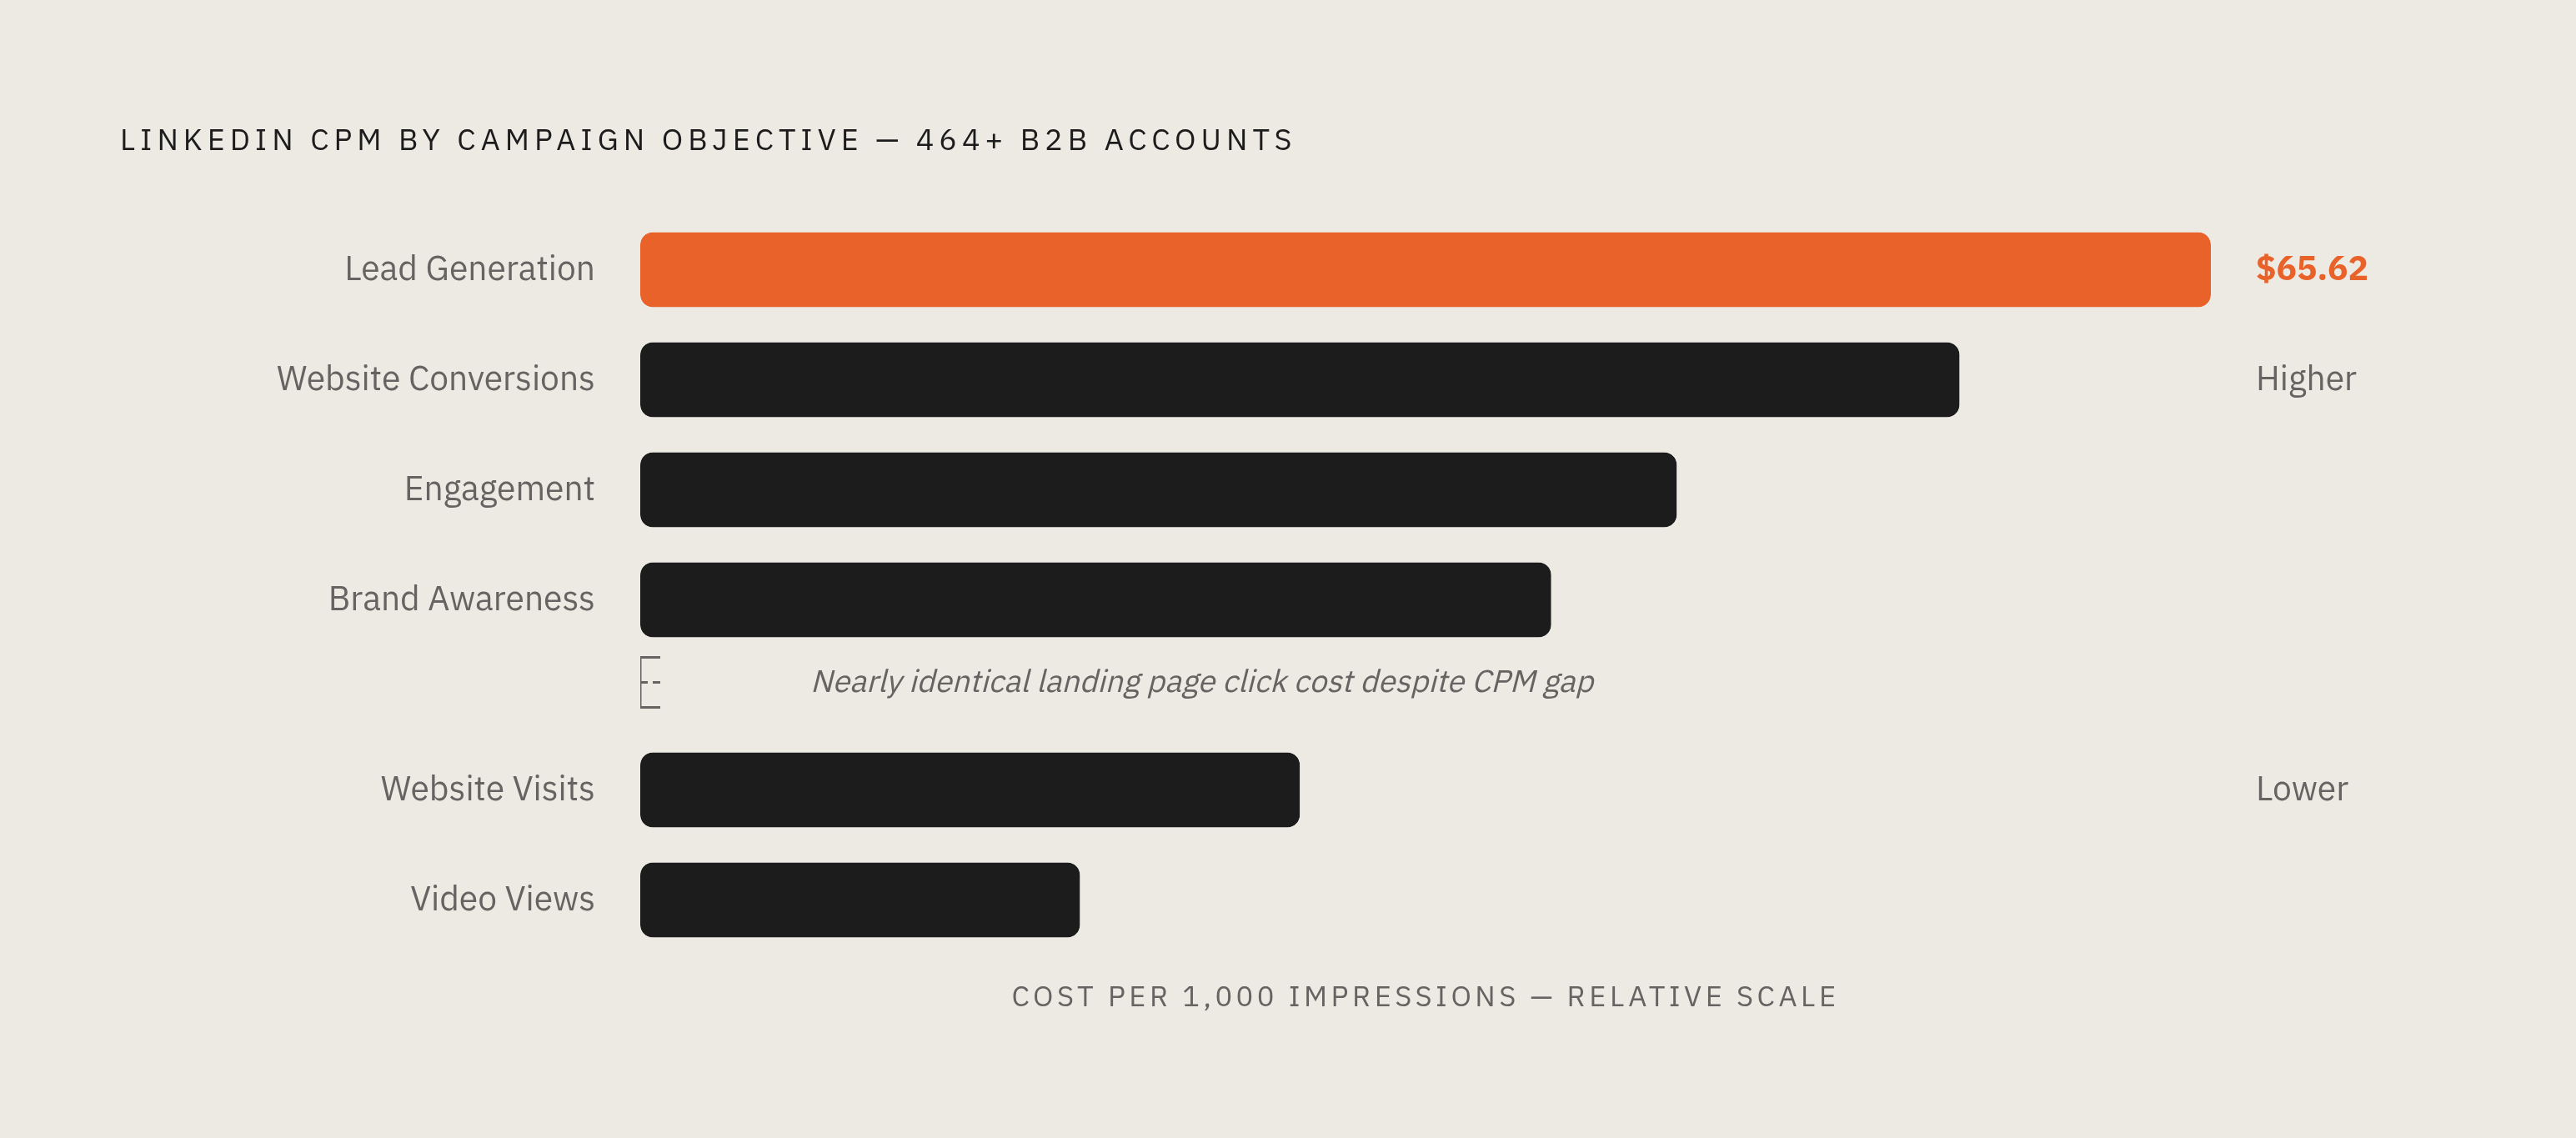
Seniority and size explain who gets reached and how much pressure sits on that pool. Objective explains what LinkedIn is being asked to do with that same pool, and it changes price by a wide margin even when the audience itself stays the same. Kiin Labs' whole-panel data, pulled across more than 464 B2B accounts, puts lead generation at $65.62 CPM, with website conversions, engagement, brand awareness, website visits, and video views each landing lower, in roughly descending order down the funnel. Lead generation costs the most because LinkedIn is being asked to find people likely to complete a form, a harder and more competitive action to optimize for than simply showing an ad to someone who might glance at it. Brand awareness, by contrast, draws from the broadest, most reach-efficient pool LinkedIn can serve, so it costs the least per thousand impressions.
The sharpest finding in this part of the data is a paired result from the same set of accounts: brand awareness and engagement objectives produce nearly identical landing page click costs, despite sitting at different points on the CPM ladder. A CPM gap between two objectives doesn't automatically carry through to a proportional gap in what it actually costs to get someone to click through to a landing page. That reframes how objective selection should be thought about. Rather than picking an objective because it matches a textbook funnel stage, match it to the audience pool in front of it: brand awareness works well against cold audiences of meaningful scale, while engagement suits retargeting pools, uploaded lists, smaller audiences, and video content. Objective is a matching decision, not a label pulled from a funnel diagram.
The benchmark map, CPM ranges by ICP, geography, and audience type
Narrow enterprise targeting, C-suite titles at companies with 1,000 or more employees, runs $90 to $150 CPM. Ultra-narrow targeting stacks specific titles against specific industries and specific company sizes, and it runs $150 to $300 CPM. The same three-tier pattern appears in every region The Smarketers measured for 2026, just shifted up or down depending on local demand. Western Europe (the UK, Germany, France, and the Netherlands) runs broad B2B at $50 to $80 CPM, with narrow enterprise in the mid-to-upper range for the region and ultra-narrow at the high end. APAC (Singapore, Australia, and Japan) runs broad B2B at $35 to $60 CPM, narrow enterprise at $60 to $95, and ultra-narrow at $95 to $170. India and LATAM sit lowest across the board, with broad B2B at $20 to $38 CPM and narrow enterprise and ultra-narrow following the same mid-range-to-high-end pattern seen elsewhere.
Audience type is a fourth axis, on top of ICP and geography. Kiin Labs' 2026 panel puts cold audiences at $36.44 CPM, retargeting audiences at $46.02, and uploaded list audiences at $58.00. Retargeting and list audiences cost more per impression than cold prospecting, which looks at first glance like a worse deal. It isn't, because those warmer audiences convert at rates cold audiences can't match: retargeting shows higher engagement, higher landing page click-through rate, more conversions per click, and lower cost per conversion than list targeting across paired comparisons.
When a lower CPM means a worse campaign
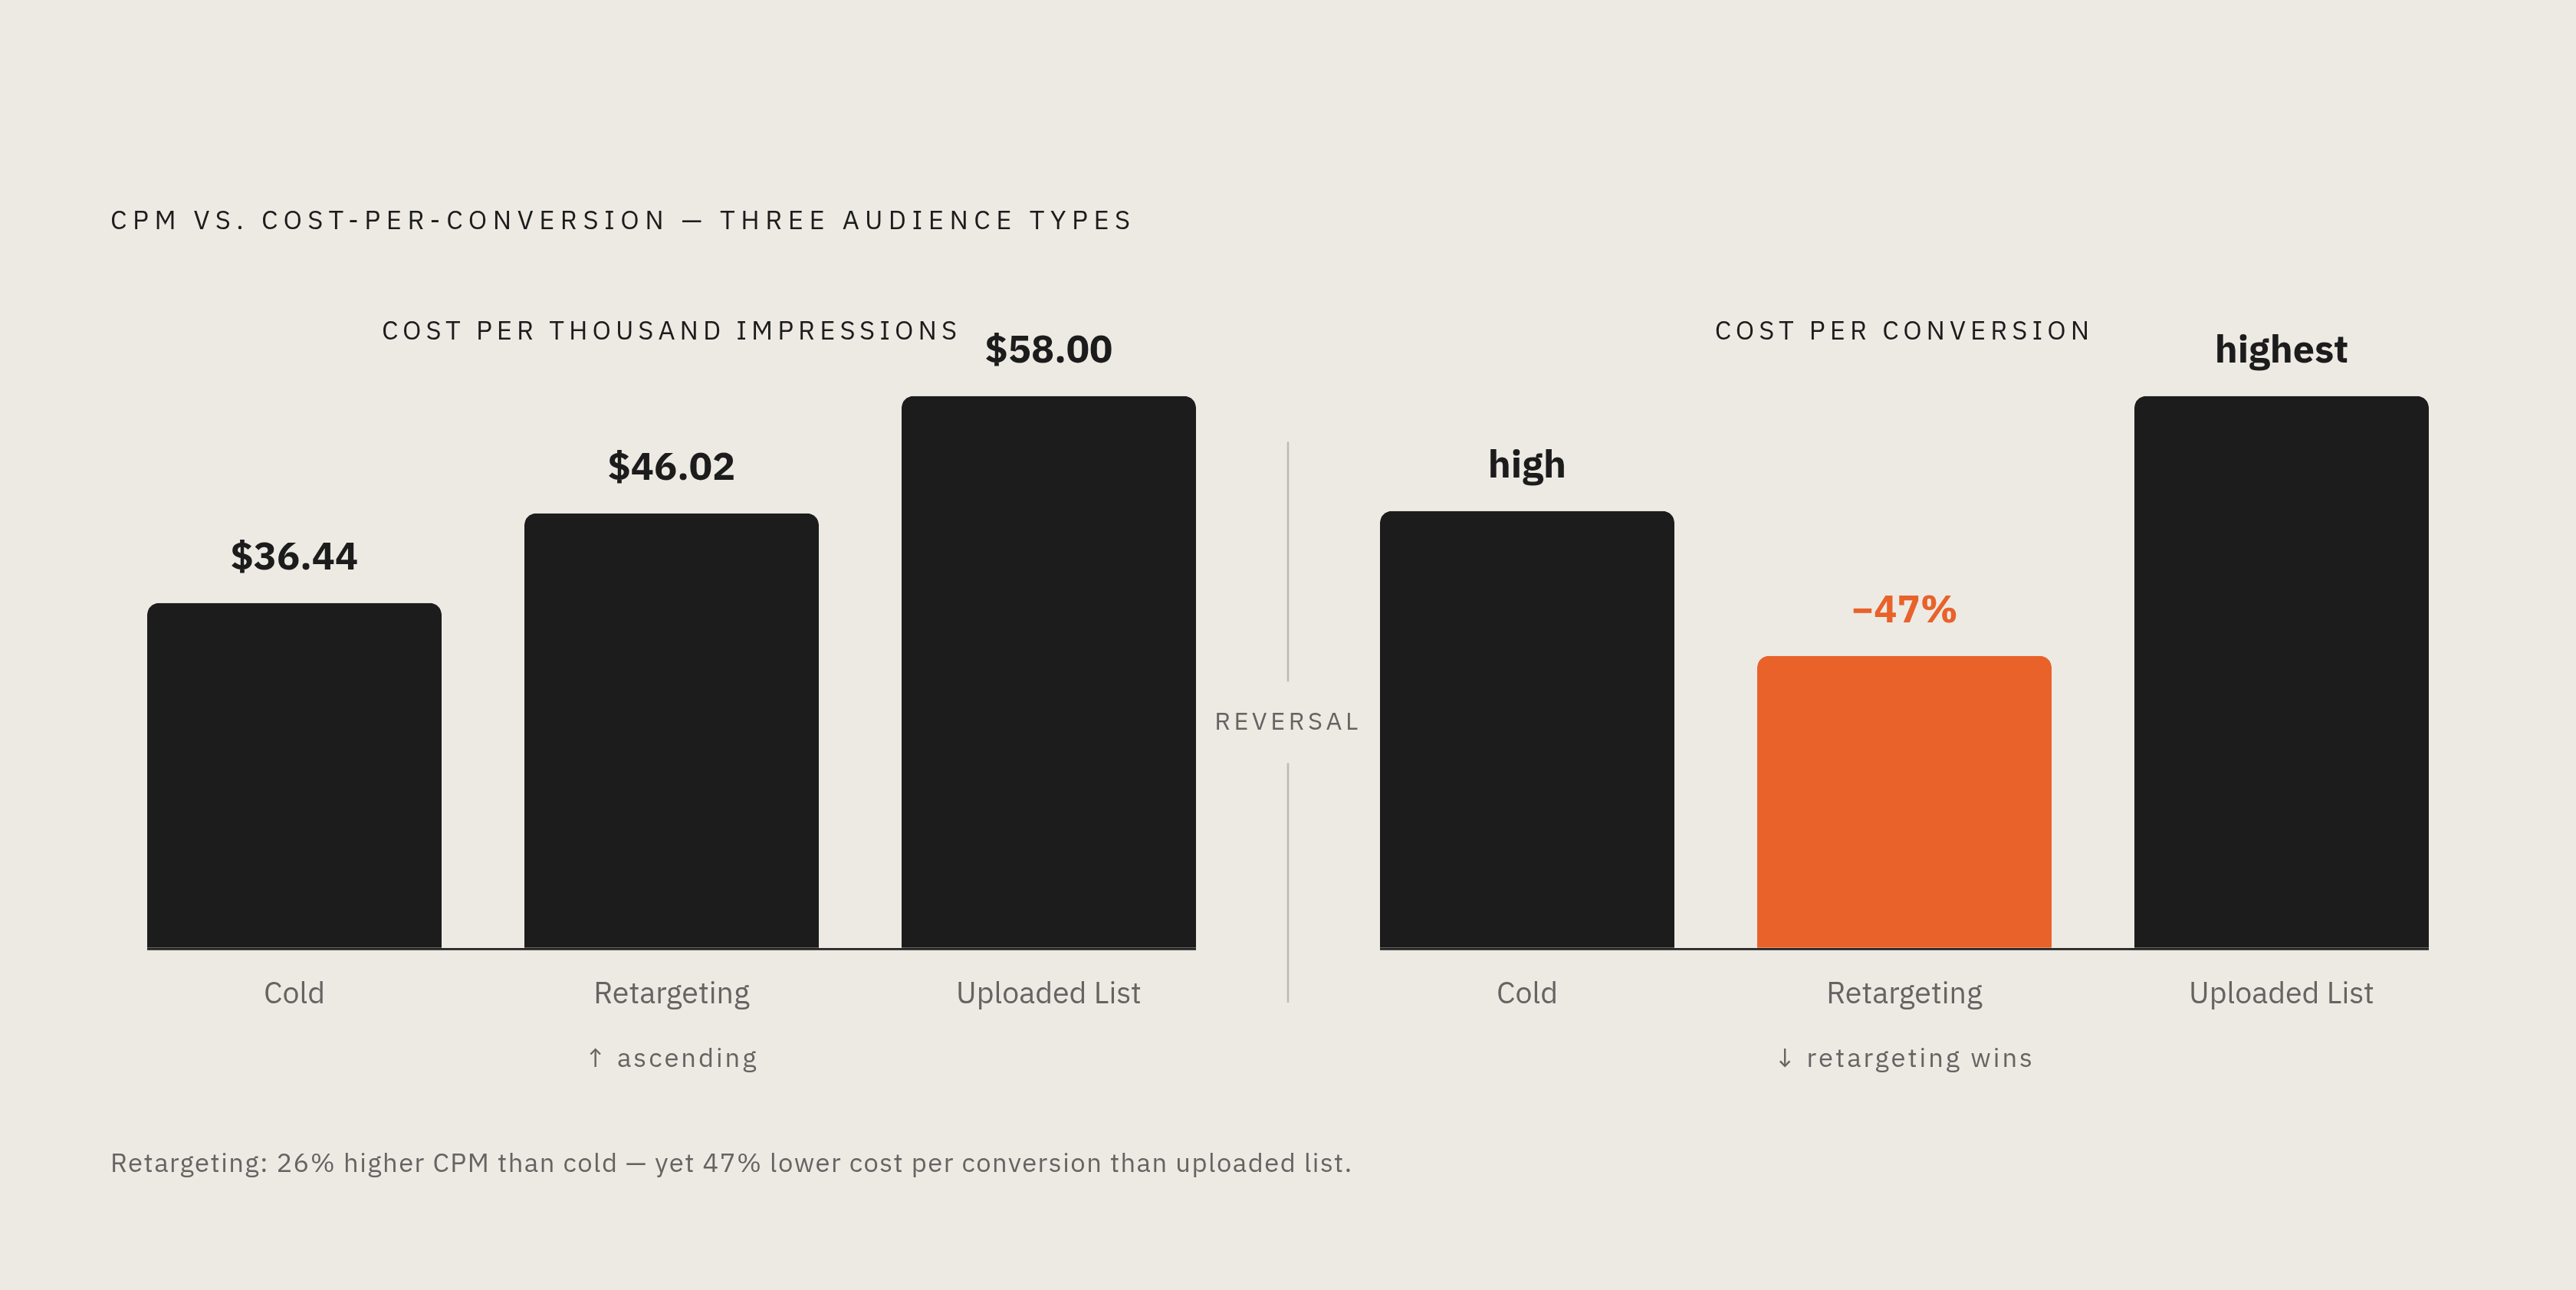
Retargeting audiences cost more per impression than cold audiences, but they still produce materially better downstream returns. Kiin Labs' 2026 data finds that retargeting audiences have a cost per conversion 47% lower than list targeting, even though their CPM runs higher than both cold and list audiences on their own. If you optimize purely toward the cheapest CPM, the campaign drifts toward colder, less-converting audiences almost by default, because cheap impressions and valuable impressions are not the same thing.
The same logic holds at the ICP level. Enterprise cost-per-lead looks high next to SMB cost-per-lead, and if a budget review stops there, it will usually push spend toward the SMB side. But unit economics typically favor enterprise anyway, because average contract value scales up right alongside the higher CPL. The number you should track is pipeline-weighted cost, not raw CPL sitting on its own. Teams that treat CPM or CPL as the primary scoreboard tend to drift toward whoever converts easiest to fill out a form, students, job seekers, small businesses browsing on a lunch break. Cost per sales-accepted lead, or cost per SQL, tells you a truer story than cost per form fill ever will.
Attribution timing makes this harder to see clearly. LinkedIn's default attribution window counts conversions within thirty days of a click, so if a deal runs a multi-month sales cycle, it misses a large share of the pipeline LinkedIn actually influenced. LinkedIn tends to shape the early and middle parts of a buyer's journey, and last-click attribution hands credit for the eventual close to whatever channel happened to get clicked last. Feeding LinkedIn's Conversion API real conversion data in real time, following LinkedIn's own best practices, changes which campaigns the platform's algorithm favors going forward, because the system starts bidding on signals that reflect actual lead quality. CAPI adoption functions as a structural lever on both CPM and CPL for that reason: better signals in change which impressions get bought on the advertiser's behalf.
Timing and seasonality effects on CPM
CPM moves across the calendar year even when you freeze audience, objective, and every other setting in place. Kiin Labs tracks the same advertisers across different periods instead of comparing different account mixes, and that within-account data shows March running meaningfully below a campaign's typical monthly CPM. The transition from Q1 into Q2 tells the opposite story: CPM rises substantially, and cost per landing page click rises by an even larger margin, inside those same accounts.
December doesn't follow the pattern marketers often assume. Kiin Labs puts December CPM at an index of 104, above the typical month rather than discounted the way a lot of B2B teams expect heading into the holidays, with engagement also running above average at an index of 105. Pausing spend in December isn't supported by what the data shows. Sunday CPM runs modestly below a campaign's typical daily rate, and weekend days show higher landing page click-through rates. Dayparting weekends out of a campaign schedule, one of the most common adjustments B2B accounts make, cuts out the cheapest, highest-clicking share of the week's delivery.
Put together, three timing decisions fall out of this data cleanly. Front-load your annual budget into Q1, when the same audience gets you more impressions per dollar. Keep December spend running rather than pausing it on a seasonal assumption the numbers don't back up. Leaving weekends in the schedule instead of dayparting them out preserves that cheaper, higher-clicking delivery. A CPM spike entering Q2 reflects the auction shifting under a fixed strategy, not a sign that the campaign itself broke, and reading it as the latter leads to changes that weren't actually necessary.
Diagnosing your own account with the benchmark data
All of this gives a marketer looking at their own CPM something concrete to measure it against: the benchmark ranges by ICP narrowness, by geography, and by objective laid out above. Placed side by side with those figures, a given account's number starts to reveal whether the cost is structural, a function of the audience being targeted, or operational, a function of the pressure being put on that audience through budget or scheduling choices.
A diagnostic order falls directly out of the three-variable framework this piece has built. Check seniority mix second, since a C-suite-only campaign always carries that two-to-three-times multiplier, then check objective match third, because lead generation running against a small, cold audience compounds both of the problems above at once. Check timing last, since a Q2 CPM reading looks alarming only if you compare it against a Q4 baseline instead of the seasonal pattern it actually belongs to. CPM explains the majority of the variance in cost per landing page click across accounts. Fixing the structural causes behind it, audience breadth, objective selection, and timing, moves the needle further than creative tweaks ever will on their own.