LTV to CAC Ratio as a LinkedIn Paid Media Accountability Metric
Channel-level LTV:CAC reveals which paid platforms actually drive profitable growth.

Boards don't approve budget increases on faith anymore. They want unit economics, and they want them before the next spend request lands on the table. The trouble is that the number most marketing teams bring into that room, a single blended LTV:CAC ratio for the whole company, can't actually answer the question being asked. It tells a board whether the business overall is making money on what it spends. It says nothing about whether LinkedIn specifically is one of the channels doing that work.
That's a problem because a blended ratio can look perfectly healthy while one channel inside it is quietly burning cash. Nobody questions the losing channel, because nobody can see it. Budget keeps flowing to it by default, because the blended math never gave anyone a reason to look twice.
Channel-level LTV:CAC fixes that by isolating each paid platform's own unit economics. Blend them together, and the signal that separates the channel creating enterprise value from the one destroying capital disappears completely.
Picture a buyer who researches a product category on G2, sees LinkedIn content across several touchpoints over a couple of months, then finally converts by typing the brand name into Google. Last-click attribution hands all the credit to Google. That contribution across those touchpoints never appears in the attribution model. The blended ratio that comes out the other end isn't measuring reality. It measures an accounting convenience, one that happens to favor whichever channel closes the deal last.
A LinkedIn-Specific LTV:CAC Ratio
A single benchmark applied across every paid channel will misjudge at least one of them, because LinkedIn's cost structure and deal economics don't resemble Google's or Meta's. Treating them as interchangeable guarantees the wrong read on at least one platform.
Start with cost per lead. On its own, that looks like a strike against the platform. Judging LinkedIn on CPL alone is judging it on the wrong currency.
The targeting mechanism is why the leads are worth more. Advertisers can filter LinkedIn campaigns by job title, seniority, and company size, so they reach actual members of a buying committee. LinkedIn filters toward the right buyer before the click even happens. Because of that, LTV for LinkedIn-sourced customers takes a different shape than LTV for customers sourced anywhere else.
LTV has to be calculated separately for LinkedIn-sourced cohorts, using actual retention data for those customers rather than a company-wide average, and that's why. Blend them into one LTV figure and the number stops representing either one accurately. LinkedIn needs its own ratio because its inputs, on both the cost side and the value side, genuinely behave differently from the rest of the paid stack.
The five inputs required to calculate a credible LinkedIn-specific LTV:CAC
A LinkedIn LTV:CAC ratio is only as trustworthy as the five numbers feeding into it, and most marketing teams have at least two of those numbers wrong before the calculation even starts. Before trusting any ratio, audit against this list and see how many hold up.
Using the company average for a channel-specific decision defeats the purpose of isolating the channel.
Fully-loaded CAC comes second, and it's where most ratios quietly fall apart. Paid media spend alone isn't the full cost of acquisition. One brand's fully-loaded CAC came in 73% higher than its paid-media-only figure. That's a gap large enough to turn a ratio that looks comfortably above the 3:1 floor into one that's actually struggling, simply because half the true cost never made it into the spreadsheet a CFO is reading.
Channel-cohort LTV is third: LTV equals ARPU times gross margin, divided by churn rate, calculated specifically for LinkedIn-sourced customers using their own gross margin figures.
Net new ARR and SQL pipeline by channel round out the five: LinkedIn ad platform data has to connect through the CRM all the way to closed-won revenue.
Full pipeline attribution linking LinkedIn spend to CRM revenue is what makes all five inputs possible, and only a small share of B2B SaaS companies maintain it. Everyone else defaults back to CPL, and that, as the next section covers, actively trains the ad platform toward exactly the wrong audience at scale.
Why CPL optimization actively corrupts the inputs needed for a real LinkedIn LTV:CAC
Optimizing a LinkedIn campaign for cost per lead corrupts the lead quality that every one of the five inputs above depends on. The ratio can look like it's improving while the actual cohort it's built on gets worse, quarter over quarter.
The mechanism: reported cost per conversion falls, and on the surface, everything looks like it's working.
A low CPL paired with a low MQL rate is a worse outcome than a high CPL paired with a high MQL rate. The number that actually matters sits downstream of the form fill, not at the form fill itself. Chasing CPL optimizes for the wrong finish line.
Target cost per SQL and evaluate it against ACV tier. You won't see any of that hiding until pipeline reviews start to raise uncomfortable questions.
This connects directly back to LTV:CAC. A cohort built from low-seniority, off-ICP leads carries lower average contract value and higher churn, and both of those compress LTV at the same time. A ratio calculated from a CPL-optimized program understates what LinkedIn could actually deliver with the right targeting, and if those leads do manage to close, the ratio can just as easily overstate the channel's health by papering over a cohort that's about to churn.
The attribution gap that systematically understates LinkedIn's contribution to LTV:CAC
Last-click attribution has a bias problem that runs in the opposite direction from CPL corruption, and it misassigns LinkedIn-influenced pipeline to other channels often enough to get LinkedIn's budget cut for the wrong reason.
Most deals LinkedIn genuinely influences go unrecorded in last-click reporting. Google gets full credit in the attribution model. LinkedIn did the work of building awareness and consideration over that entire window, but it gets nothing.
Fixing it requires attribution connected through the CRM that tracks the full journey, LinkedIn touchpoints, content engagement, the downstream SQL, and the eventual closed-won outcome, rather than relying on whatever the ad platform itself reports as a conversion.
Without that connected loop, you end up building the LinkedIn LTV:CAC calculation on an undercount of the pipeline the channel actually influenced. The ratio reads worse than reality, and a budget decision made against that fiction cuts a channel that's producing returns nobody can see.
A Healthy LinkedIn LTV:CAC by ACV Tier
There's no single number that defines a healthy LinkedIn LTV:CAC. It shifts by ACV tier and by company stage, and the right threshold for a given program should be built backward from revenue targets before a single dollar goes toward a campaign.
The widely cited floor for B2B SaaS generally is 3:1. A ratio that climbs above 5:1 usually isn't a sign of superior efficiency so much as a sign of underinvestment: the business could be putting more money into growth and isn't.
The backward-build method turns that floor into a planning tool. Target CAC equals LTV divided by the target LTV:CAC ratio. Start with the revenue target, work out the maximum CAC that ratio allows, and from there work out the maximum CPL the campaign can tolerate, all before launch.
For a mid-market product, take its LTV and divide by a target ratio, say 4:1, to land on a maximum allowable CAC. Apply a blended MQL-to-close rate to that CAC figure to back into a maximum allowable CPL. The model only fails once actual CPL climbs past that derived ceiling, and that ceiling is knowable in advance, not discovered after the budget is already spent.
You should also track a parallel metric alongside the ratio: 180-day pipeline ROAS. Top-quartile programs aim for a pipeline ROAS meaningfully above the industry median, and that top-quartile figure climbs even higher when measured over a longer window. This view groups spend by the month it was incurred and tracks the pipeline and closed revenue that spend eventually produced, reflecting the full sales cycle.
Interpreting a LinkedIn LTV:CAC Ratio
A LinkedIn LTV:CAC ratio sitting below threshold has exactly two possible root causes: a CAC problem or an LTV problem. They call for different fixes, and treating them as interchangeable burns both budget and time chasing the wrong lever.
A useful way to sort channels is a two-axis matrix: payback period on one axis, channel-specific LTV:CAC on the other. Channels with short payback and high LTV:CAC earn budget priority. Channels with long payback and low LTV:CAC become candidates for elimination.
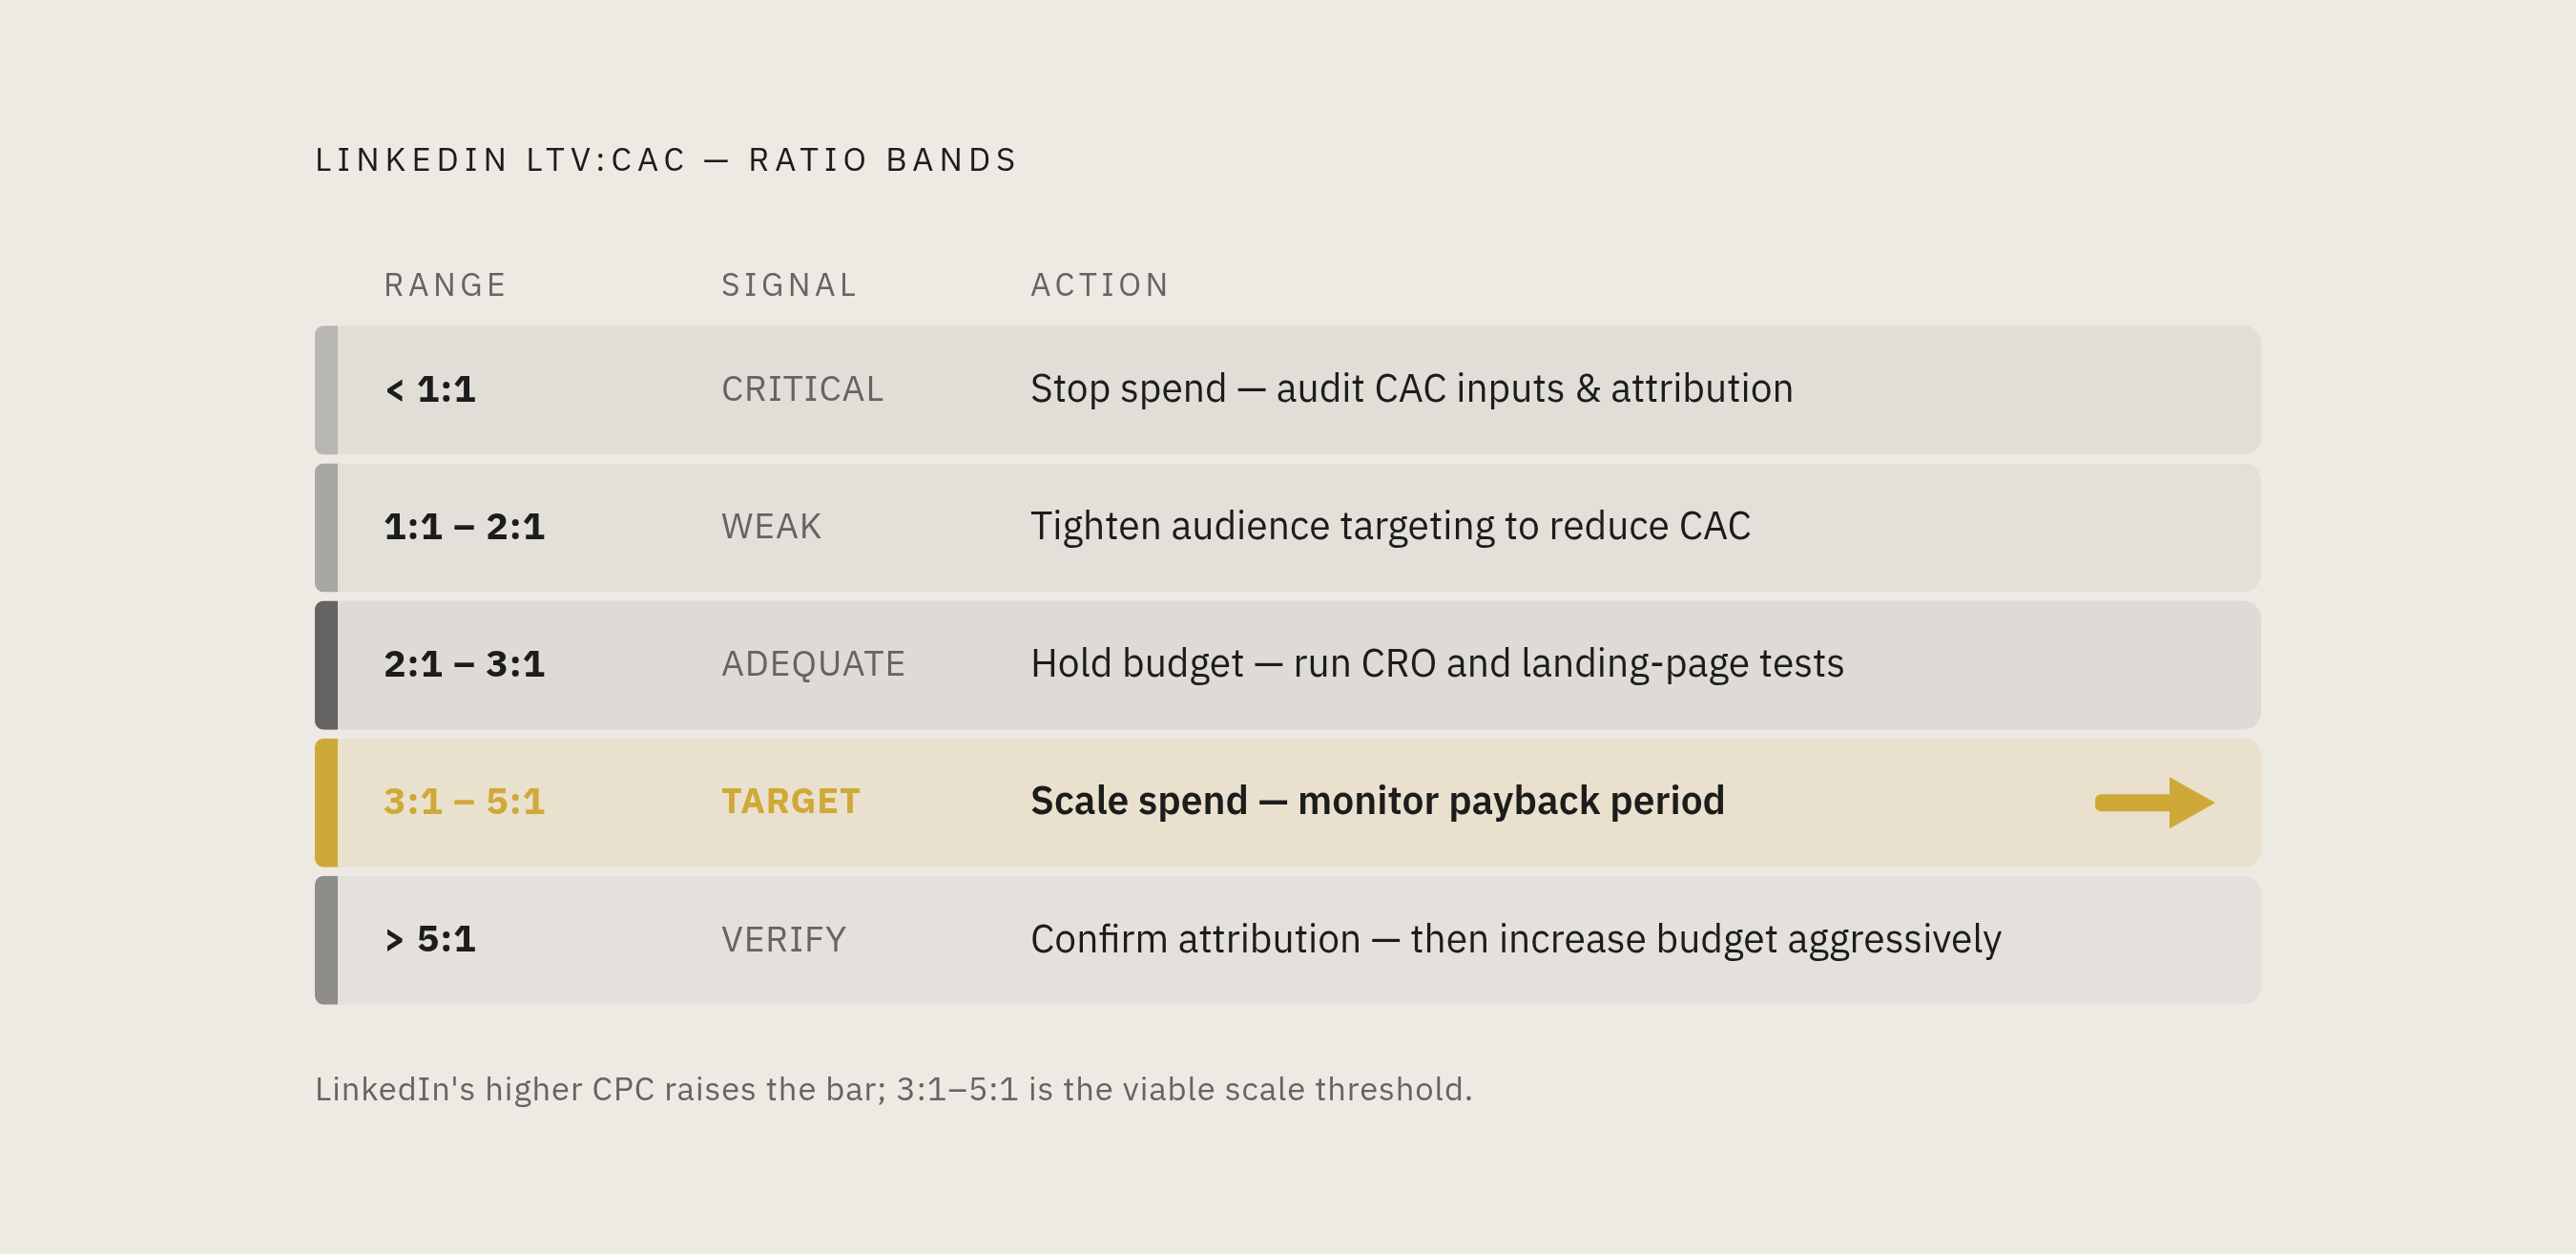
For LinkedIn specifically, the ratio band itself points to the action:
- Below 1:1 means the channel is losing capital on every customer acquired. Stop spend immediately, then audit the CAC inputs and the attribution model before resuming anything.
- Between 1:1 and 2:1 is common at launch, usually because audience targeting is still too broad. Reduce CAC through tighter audience refinement.
- Between 2:1 and 3:1 sits just below the healthy minimum. Hold the budget where it is, run conversion rate optimization and landing-page tests, and confirm improvement before adding spend.
- Between 3:1 and 5:1 counts as strong for LinkedIn, given its higher cost per click compared to other channels. Scale spend, but check payback period alongside it to confirm cash flow can support the scale.
- Above 5:1 is exceptional and usually points to a high-ACV, long-retention cohort. Confirm attribution isn't over-crediting the channel, and if it checks out, increase budget aggressively.
Once the diagnosis points to CAC, the levers are audience refinement to raise ICP match rate, landing-page conversion improvements (a meaningful lift in conversion rate lowers CAC without spending another dollar), negative targeting to exclude titles and company sizes outside the ICP, and shifting budget from broad awareness campaigns toward retargeting warmer audiences.
If the diagnosis points to LTV instead, churn is the lever that moves the number most. A meaningful drop in monthly churn raises LTV significantly, and the same LinkedIn spend can look radically different in LTV:CAC terms depending entirely on retention performance, a variable paid media reporting typically never touches.
Disconnected Campaign Structure and LinkedIn LTV:CAC
None of the diagnosis above holds up over time if creative, landing pages, attribution, and paid media sit in separate hands with separate accountability lines. A LinkedIn LTV:CAC ratio can be calculated once under those conditions. Managing it on an ongoing basis is another matter.
CRM-synced bidding is the mechanism that closes the loop between pipeline outcomes and LinkedIn's own algorithm, and it requires one team to control both the definition of what counts as a conversion event and the CRM integration itself. Splitting that ownership across two teams breaks the feedback loop at the exact point where it matters most.
Creative and landing pages both sit on the CAC side of the ratio. Creative quality determines who clicks and what that click costs. Landing page conversion rate determines how many of those clicks turn into SQLs, which is also a CAC input. A team that can adjust the ads but can't touch the landing page is optimizing one half of CAC while leaving the larger half fixed in place.
Attribution integrity needs the same single-owner structure. Someone has to own the full journey from LinkedIn impression through to CRM closed-won. Splitting that responsibility across an agency, a RevOps team, and an in-house marketer leaves no single party with either the visibility or the incentive to keep that journey intact.
Board reporting built on pipeline metrics rather than platform-reported numbers only happens when the team that built the attribution layer is also the team presenting the results. If you separate those two roles, the temptation shifts toward reporting whichever number looks better, usually the platform's own conversion count. A management structure decoupled from spend volume aligns incentives with the ratio.
How accumulated campaign intelligence compounds LinkedIn LTV:CAC over time
When teams treat LinkedIn LTV:CAC as a continuous feedback loop, checking it and acting on it constantly, they build an efficiency advantage that teams running a quarterly blended-ratio report structurally cannot match.
Every campaign cycle that connects LinkedIn spend to CRM outcomes leaves evidence behind: which audience segments produce the cohorts with the strongest LTV, which creative angles correlate with lower churn down the line, which landing page variants raise MQL-to-SQL rates. That evidence makes the next budget decision faster to make and more accurate when it's made.
The churn multiplier moves in the same direction as that accumulated evidence. As targeting tightens based on what closed-won cohort data actually shows, the customers LinkedIn acquires carry higher retention. Higher retention raises LTV for the same level of spend, improving the ratio without changing CAC.
That's also why a ratio above 5:1 reads differently for a team with this system in place. The signal, that spend could be more aggressive, only turns into action when a team has the infrastructure to trust the number and reinvest behind it. A team still working from a blended company-wide ratio can't see that opportunity clearly enough to act on it.
A B2B marketing team that has built LinkedIn-specific cohort LTV, clean attribution, and a creative-to-CRM system connected end to end gets more than just a better number to report. Before the next budget review, the question is whether the LinkedIn program is getting smarter each quarter, or starting over from scratch every time someone asks it to justify its spend.